Quick Start
The following quick-start guide will take you through the basics of FlexChart control.
.NET Framework
This quick start will guide you through the steps of creating a simple line symbol chart using the FlexChart control. Follow the steps below to get started:
Set up the application
Create a new Windows Forms app.
Drag and drop the FlexChart control from the toolbox onto the form.
Observe: A column type chart is drawn with a default data.
Bind the FlexChart control to a data source
Create a data source.
public List<Product> GetProductRevenue()
{
    List<Product> _list = new List<Product>();
    _list.Add(new Product() { Name = "Desktop", Date = new DateTime(2018, 04, 07), Orders = 265, Revenue = 6625 });
    _list.Add(new Product() { Name = "Desktop", Date = new DateTime(2018, 05, 08), Orders = 107, Revenue = 2675 });
    _list.Add(new Product() { Name = "Mouse", Date = new DateTime(2018, 06, 02), Orders = 56, Revenue = 560 });
    _list.Add(new Product() { Name = "Mouse", Date = new DateTime(2018, 07, 06), Orders = 572, Revenue = 5720 });
    _list.Add(new Product() { Name = "Mouse", Date = new DateTime(2018, 08, 05), Orders = 468, Revenue = 4680 });
    _list.Add(new Product() { Name = "Printer", Date = new DateTime(2018, 09, 02), Orders = 154, Revenue = 2310 });
    _list.Add(new Product() { Name = "Desktop", Date = new DateTime(2018, 10, 03), Orders = 89, Revenue = 2225 });
    _list.Add(new Product() { Name = "Desktop", Date = new DateTime(2018, 11, 05), Orders = 347, Revenue = 8675 });
    _list.Add(new Product() { Name = "Printer", Date = new DateTime(2018, 12, 07), Orders = 204, Revenue = 3060 });
    _list.Add(new Product() { Name = "Printer", Date = new DateTime(2019, 01, 03), Orders = 34, Revenue = 510 });
    _list.Add(new Product() { Name = "Mouse", Date = new DateTime(2019, 02, 06), Orders = 223, Revenue = 2230 });
    _list.Add(new Product() { Name = "Desktop", Date = new DateTime(2019, 03, 08), Orders = 119, Revenue = 2975 });
    return _list;
}
Public Function GetProductRevenue() As List(Of Product) Dim _list As New List(Of Product)() _list.Add(New Product() With {.Name = "Desktop", .Date = New DateTime(2018, 4, 7), .Orders = 265, .Revenue = 6625}) _list.Add(New Product() With {.Name = "Desktop", .Date = New DateTime(2018, 5, 8), .Orders = 107, .Revenue = 2675}) _list.Add(New Product() With {.Name = "Mouse", .Date = New DateTime(2018, 6, 2), .Orders = 56, .Revenue = 560}) _list.Add(New Product() With {.Name = "Mouse", .Date = New DateTime(2018, 7, 6), .Orders = 572, .Revenue = 5720}) _list.Add(New Product() With {.Name = "Mouse", .Date = New DateTime(2018, 8, 5), .Orders = 468, .Revenue = 4680}) _list.Add(New Product() With {.Name = "Printer", .Date = New DateTime(2018, 9, 2), .Orders = 154, .Revenue = 2310}) _list.Add(New Product() With {.Name = "Desktop", .Date = New DateTime(2018, 10, 3), .Orders = 89, .Revenue = 2225}) _list.Add(New Product() With {.Name = "Desktop", .Date = New DateTime(2018, 11, 5), .Orders = 347, .Revenue = 8675}) _list.Add(New Product() With {.Name = "Printer", .Date = New DateTime(2018, 12, 7), .Orders = 204, .Revenue = 3060}) _list.Add(New Product() With {.Name = "Printer", .Date = New DateTime(2019, 1, 3), .Orders = 34, .Revenue = 510}) _list.Add(New Product() With {.Name = "Mouse", .Date = New DateTime(2019, 2, 6), .Orders = 223, .Revenue = 2230}) _list.Add(New Product() With {.Name = "Desktop", .Date = New DateTime(2019, 3, 8), .Orders = 119, .Revenue = 2975}) Return _list End FunctionBind the FlexChart to this data source by setting the DataSource property.
//Passing data to FlexChart
this.flexChart1.DataSource = GetProductRevenue();
'Passing data to FlexChart Me.flexChart1.DataSource = GetProductRevenue()
Configure the FlexChart control
Clear the default series getting displayed in the chart.
Add a new series using Add method and configure the X and Y axes by setting the BindingX and Binding property.
Configure the chart by setting the ChartType and other required properties.
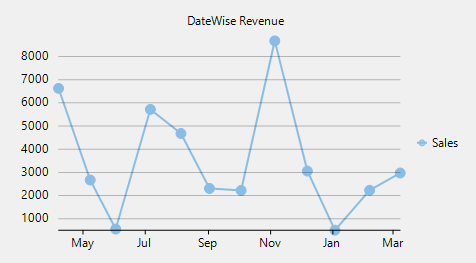
flexChart1.Series.Clear();
//Selecting chart's type
this.flexChart1.ChartType = C1.Chart.ChartType.LineSymbols;
//Setting chart's Header and styling it
this.flexChart1.Header.Content = "DateWise Revenue";
//Adding a Series to chart and binding it (AxisY) to 'Revenue' field of DataCollection
this.flexChart1.Series.Add(new C1.Win.Chart.Series
{
    //Name property specifies the string to be displayed corresponding to this Series in Legend
    Name = "Sales",
    Binding = "Revenue"
});
//Binding chart's AxisX to 'Date' so Dates are shown in Horizontal axis
this.flexChart1.BindingX = "Date";
flexChart1.Series.Clear() 'Selecting chart's Type Me.flexChart1.ChartType = C1.Chart.ChartType.LineSymbols 'Setting chart's Header and styling it Me.flexChart1.Header.Content = "Datewise Revenue" 'Adding a Series to chart and binding it (AxisY) to 'Revenue' field of DataCollection 'Name property specifies the string to be displayed corresponding to this Series in Legend Me.flexChart1.Series.Add(New C1.Win.Chart.Series() With { .Name = "Sales", .Binding = "Revenue" }) 'Binding chart's AxisX to 'Date' so Dates are shown in Horizontal axis Me.flexChart1.BindingX = "Date"
.NET
To create a simple WinForms application in .NET for FlexChart control complete the following steps:
Create a new Windows Forms application.
Switch to code editor. Initialize and add the FlexChart control to the form.
// Initialize the control
FlexChart flexChart = new FlexChart();
// Add the control to form
this.Controls.Add(flexChart);
3. Create a data source:
// Creating data source
public List<Product> GetProductRevenue()
{
    List<Product> _list = new List<Product>();
    _list.Add(new Product() { Name = "Desktop", Date = new DateTime(2018, 04, 07), Orders = 265, Revenue = 6625 });
    _list.Add(new Product() { Name = "Desktop", Date = new DateTime(2018, 05, 08), Orders = 107, Revenue = 2675 });
    _list.Add(new Product() { Name = "Mouse", Date = new DateTime(2018, 06, 02), Orders = 56, Revenue = 560 });
    _list.Add(new Product() { Name = "Mouse", Date = new DateTime(2018, 07, 06), Orders = 572, Revenue = 5720 });
    _list.Add(new Product() { Name = "Mouse", Date = new DateTime(2018, 08, 05), Orders = 468, Revenue = 4680 });
    _list.Add(new Product() { Name = "Printer", Date = new DateTime(2018, 09, 02), Orders = 154, Revenue = 2310 });
    _list.Add(new Product() { Name = "Desktop", Date = new DateTime(2018, 10, 03), Orders = 89, Revenue = 2225 });
    _list.Add(new Product() { Name = "Desktop", Date = new DateTime(2018, 11, 05), Orders = 347, Revenue = 8675 });
    _list.Add(new Product() { Name = "Printer", Date = new DateTime(2018, 12, 07), Orders = 204, Revenue = 3060 });
    _list.Add(new Product() { Name = "Printer", Date = new DateTime(2019, 01, 03), Orders = 34, Revenue = 510 });
    _list.Add(new Product() { Name = "Mouse", Date = new DateTime(2019, 02, 06), Orders = 223, Revenue = 2230 });
    _list.Add(new Product() { Name = "Desktop", Date = new DateTime(2019, 03, 08), Orders = 119, Revenue = 2975 });
    return _list;
}
4. Bind the FlexChart control with the data source.
// Passing data to flexchart
flexChart.DataSource = GetProductRevenue();
5. Configure the control and add a chart type. Set other properties of the control.
// Configuring FlexChart
flexChart.Series.Clear();
//Selecting chart's type
flexChart.ChartType = C1.Chart.ChartType.LineSymbols;
//Setting chart's Header and styling it
flexChart.Header.Content = "DateWise Revenue";
6. Add a Series to the chart and bind it (AxisY) to the 'Revenue' field of DataCollection.
//Adding a Series to chart and binding it (AxisY) to 'Revenue' field of DataCollection
flexChart.Series.Add(new C1.Win.Chart.Series
{
    //Name property specifies the string to be displayed corresponding to this Series in Legend
    Name = "Sales",
    Binding = "Revenue"
});
7. Bind the chart's AxisX to 'Date'.
//Binding chart's AxisX to 'Date' so Dates are shown in Horizontal axis
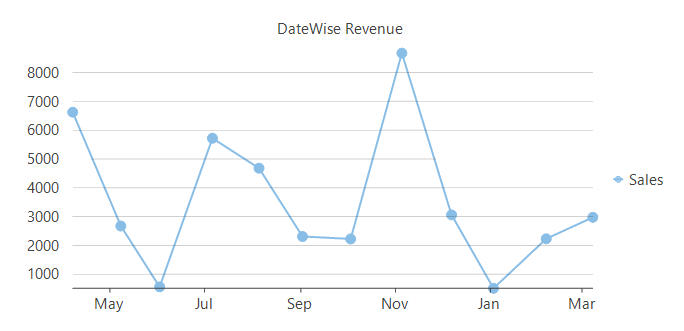
flexChart.BindingX = "Date";Run the code and observe the output: