
WinForms Box-and-Whisker
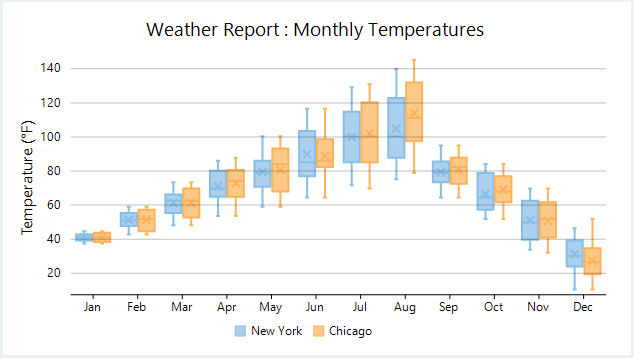
Box-and-Whisker charts are the statistical charts that display the distribution of numerical data through quartiles, means and outliers. As the name suggests, these values are represented using boxes and whiskers where boxes show the range of quartiles (lower quartile, upper quartile and median) while whiskers indicate the variability outside the upper and lower quartiles. Any point outside the whiskers is said to be an outlier. These charts are useful for comparing distributions between many groups or data sets. For instance, you can easily display the variation in monthly temperature of two cities.
Create a WinForms Box-and-Whisker Chart
In FlexChart, Box-and-Whisker can be implemented using the BoxWhisker class which represents a Box-and-Whisker series. Apart from other series related properties, this class provides properties specific to Box-and-Whisker series such as the QuartileCalculation property, which lets you specify whether to include the median in quartile calculation or not. This property accepts the values from QuartileCalculation enumeration. FlexChart also provides options to specify whether to display outliers, inner points, mean line and mean marks through ShowOutliers, ShowInnerPoints, ShowMeanLine and ShowMeanMarks properties respectively.
To create a WinForms box-and-whisker chart through code, the first step after initializing the control is to clear the default series and add a new series using the Add method. Set up the data source through the DataSource property and configure the X and Y axes by setting the BindingX and Binding property. You also need to set up the chart by setting the ChartType property and other required properties.
//Clear the Series collection
flexChart1.Series.Clear();
//Set BoxWhisker and add it to Series
var data = GetTemperatureData(new string[] { "New York", "Chicago" }, false, 365, true);
foreach (CityDataItem item in data)
{
    var ds = item.Data.GroupBy(x => x.Date.Month).SelectMany(grp => grp).OrderBy(x => x.Date.Day).Select(x => new PointD { X = x.Date.Month - 1, Y = x.HighTemp }).ToList();
    C1.Win.Chart.BoxWhisker boxWhisker = new C1.Win.Chart.BoxWhisker()
    {
        Name = item.Name,
        DataSource = ds,
        BindingX = "X",
        Binding = "Y",
        QuartileCalculation = QuartileCalculation.InclusiveMedian,
    };
    this.flexChart1.Series.Add(boxWhisker);
}
//Specify the data source
flexChart1.DataSource = GetMonthAxisDataSource();
//Set the property containing AxisX values
flexChart1.BindingX = "Value,Name";
' Method for initializing StatisticalChart
Private Sub SetupChart()
#Region "SetupChart"
'Clear the Series collection
flexChart1.Series.Clear()
'Set BoxWhisker and add it to Series
Dim data As List(Of CityDataItem) = GetTemperatureData(New String() {"New York", "Chicago"}, False, 365, True)
For Each item As CityDataItem In data
Dim ds As List(Of PointD) = item.Data.GroupBy(Function(x) x.[Date].Month).SelectMany(Function(grp) grp).OrderBy(Function(x) x.[Date].Day).[Select](Function(x) New PointD() With {
.X = x.[Date].Month - 1,
.Y = x.HighTemp
}).ToList()
Dim boxWhisker As New C1.Win.Chart.BoxWhisker() With {
.Name = item.Name,
.DataSource = ds,
.BindingX = "X",
.Binding = "Y",
.QuartileCalculation = QuartileCalculation.InclusiveMedian
}
Me.flexChart1.Series.Add(boxWhisker)
Next
'Specify the data source
flexChart1.DataSource = GetMonthAxisDataSource()
'Set the property containing AxisX values
flexChart1.BindingX = "Value,Name"Note that the above sample code uses a custom methods named GetTemperatureData and GetMonthAxisDataSource to supply data to the chart. You can set up the data source as per your requirements.
//Method for creating data for StatisticalChart
private DataSource _dataHelper = new DataSource().Instance;
private Random rnd = new Random();
public List<CategoricalPoint> GetMonthAxisDataSource()
{
    List<CategoricalPoint> data = new List<CategoricalPoint>();
    int i = 0;
    foreach (string month in _dataHelper.Months.Take(12))
    {
        data.Add(new CategoricalPoint { Name = month, Value = i });
        i++;
    }
    return data;
}
public List<CityDataItem> GetTemperatureData(string[] cities, bool monthly = false, int count = 30, bool isFahrenheit = false)
{
    var data = new List<CityDataItem>();
    var startDate = new DateTime(2017, 1, 1);
    foreach (string city in cities)
    {
        var dataItem = new CityDataItem() { Name = city };
        for (int i = 0; i < count; i++)
        {
            var temp = new Temperature();
            DateTime date;
            if (monthly)
                date = startDate.AddMonths(i);
            else
                date = startDate.AddDays(i);
            temp.Date = date;
            if (date.Month <= 8)
                temp.HighTemp = rnd.Next(3 * date.Month, 8 * date.Month);
            else
                temp.HighTemp = rnd.Next((13 - date.Month - 2) * date.Month, (13 - date.Month) * date.Month);
            temp.LowTemp = temp.HighTemp - rnd.Next(6, 8);
            temp.Precipitation = (date.Month < 4 || date.Month > 8) ? rnd.Next(100, 150) : rnd.Next(150, 200);
            if (isFahrenheit) temp.HighTemp = temp.HighTemp * 1.8 + 32;
            dataItem.Data.Add(temp);
        }
        data.Add(dataItem);
    }
    return data;
}
' Method for creating data for StatisticalChart
Private _dataHelper As DataSource = New DataSource().Instance
Private rnd As New Random()
Public Function GetMonthAxisDataSource() As List(Of CategoricalPoint)
Dim data As New List(Of CategoricalPoint)()
Dim i As Integer = 0
For Each month As String In _dataHelper.Months.Take(12)
data.Add(New CategoricalPoint() With {
.Name = month,
.Value = i
})
i += 1
Next
Return data
End Function
Public Function GetTemperatureData(cities As String(), Optional monthly As Boolean = False, Optional count As Integer = 30, Optional isFahrenheit As Boolean = False) As List(Of CityDataItem)
Dim data As List(Of CityDataItem) = New List(Of CityDataItem)()
Dim startDate As DateTime = New DateTime(2017, 1, 1)
For Each city As String In cities
Dim dataItem As CityDataItem = New CityDataItem() With {
.Name = city
}
For i As Integer = 0 To count - 1
Dim temp As Temperature = New Temperature()
Dim [date] As DateTime
If monthly Then
[date] = startDate.AddMonths(i)
Else
[date] = startDate.AddDays(i)
End If
temp.[Date] = [date]
If [date].Month <= 8 Then
temp.HighTemp = rnd.[Next](3 * [date].Month, 8 * [date].Month)
Else
temp.HighTemp = rnd.[Next]((13 - [date].Month - 2) * [date].Month, (13 - [date].Month) * [date].Month)
End If
temp.LowTemp = temp.HighTemp - rnd.[Next](6, 8)
temp.Precipitation = If(([date].Month < 4 OrElse [date].Month > 8), rnd.[Next](100, 150), rnd.[Next](150, 200))
If isFahrenheit Then
temp.HighTemp = temp.HighTemp * 1.8 + 32
End If
dataItem.Data.Add(temp)
Next
data.Add(dataItem)
Next
Return data
End Function