
WinForms Financial Charts
WinForms Candlestick Chart
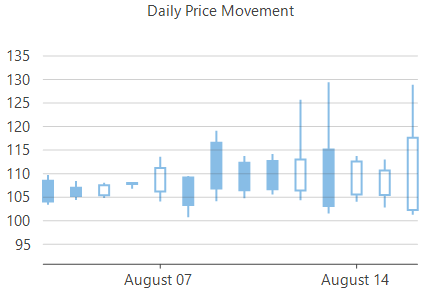
Candlestick charts are financial charts to plot open, close, high and low values of a stock over short periods of time. Each candlestick in these charts consist of a body, a wick and a tail. While body of a candlestick chart represents the opening and closing values of the stock in a particular span of time, wick and tail, the vertical lines above and below the body, indicate the highest and lowest value of stock in that time span respectively. Being packed with so much information in a single chart, these charts are used in tracking the price movements of stock.
WinForms HighLowOpenClose (HLOC) Chart
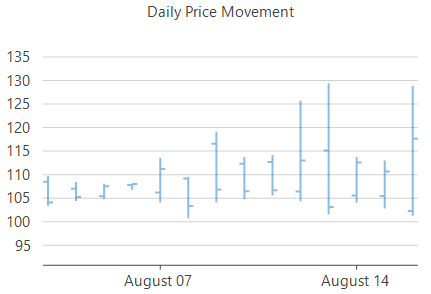
Like Candlestick charts, HighLowOpenClose charts or HLOC charts are also used to plot high, low, open and close values of stocks in a specified time frame and are used for stock analysis. The only difference from a candlestick chart is that the HLOC charts are drawn without candlestick 'body'.
Candlestick Chart | HighLowOpenClose Chart |
|---|---|
|
|
Create a WinForms Candlestick or HLOC Chart
With FlexChart, you can create Candlestick or HLOC chart by setting the ChartType property of FlexChart class to Candlestick or HighLowOpenClose. This property accepts the values from ChartType enumeration of C1.Chart namespace. You can also change the size of the candle or symbols in HLOC chart by setting the SymbolSize properties of the series.
To create a candlestick or HLOC chart using FlexChart:
At design-time
Right click the FlexChart control on form to open the Properties window.
Navigate to the ChartType property and set its value to Candlestick or HighLowOpenClose.
Set the data source using the DataSource property.
Configure X-axis and Y-axis values by setting the BindingX and Binding property respectively.
Using code
To create a WinForms HLOC or candlestick chart through code, the first step after initializing the control is to clear the default series and add a new series using the Add method. Set up the data source through the DataSource property and configure the X and Y axes by setting the BindingX and Binding property. You also need to set up the chart by setting the ChartType property and other required properties.
this.flexChart1.Series.Clear();
//Getting data
var data = GetQuotes(350);
//Setting FinancialChart's Header
this.flexChart1.Header.Content = "Daily Price Movement";
//Binding FinancialChart's AxisX to 'Date' so dates appear in Horizontal axis
this.flexChart1.BindingX = "Date";
//Creating and adding a series in FinancialChart with Chart Type of HighLowOpenClose
var _sPrice = new Series
{
    Name = "Price",
    Binding = "High,Low,Open,Close",
    ChartType = ChartType.HighLowOpenClose,
};
this.flexChart1.Series.Add(_sPrice);
////Setting Min and Max values for AxisY
var minPrice = data.Min((q) => q.Low);
var maxPrice = data.Max((q) => q.High);
this.flexChart1.AxisY.Min = minPrice - 10;
this.flexChart1.AxisY.Max = maxPrice + 10;
//Formatting AxisX labels
this.flexChart1.AxisX.Format = "MMMM dd";
//Passing data in FinancialChart
this.flexChart1.DataSource = data;
' Method for initializing FinancialChart
Protected Sub SetupChart()
#Region "SetupChart"
Me.flexChart1.Series.Clear()
'Getting data
Dim data As List(Of Quote) = GetQuotes(350)
'Setting FinancialChart's Header
Me.flexChart1.Header.Content = "Daily Price Movement"
'Binding FinancialChart's AxisX to 'Date' so dates appear in Horizontal axis
Me.flexChart1.BindingX = "Date"
'Creating and adding a series in FinancialChart with Chart Type of HighLowOpenClose
Dim _sPrice As Series = New Series() With {
.Name = "Price",
.Binding = "High,Low,Open,Close",
.ChartType = ChartType.HighLowOpenClose
}
Me.flexChart1.Series.Add(_sPrice)
'''/Setting Min and Max values for AxisY
Dim minPrice As Double = data.Min(Function(q) q.Low)
Dim maxPrice As Double = data.Max(Function(q) q.High)
Me.flexChart1.AxisY.Min = minPrice - 10
Me.flexChart1.AxisY.Max = maxPrice + 10
'Formatting AxisX labels
Me.flexChart1.AxisX.Format = "MMMM dd"
'Passing data in FinancialChart
Me.flexChart1.DataSource = dataNote that the above sample code uses a custom method named GetQuotes to supply data to the chart. You can set up the data source as per your requirements.
// Method for creating data for FinancialChart
private static List<Quote> dt;
public static List<Quote> GetQuotes(int count = 365)
{
var buildDir = Path.GetDirectoryName(System.Reflection.Assembly.GetExecutingAssembly().Location);
var quotesPath = Path.Combine(buildDir, "Resources", "HistoricalQuotes.json");
var text = File.ReadAllText(quotesPath);
var jsonSerializer = new JavaScriptSerializer();
dt = jsonSerializer.Deserialize<List<Quote>>(text);
count = Math.Min(count, dt.Count);
return dt.Take(count).ToList();
}
' Method for creating data for FinancialChart
Private Shared dt As List(Of Quote)
Public Shared Function GetQuotes(Optional count As Integer = 365) As List(Of Quote)
Dim buildDir = Path.GetDirectoryName(System.Reflection.Assembly.GetExecutingAssembly().Location)
Dim quotesPath = Path.Combine(buildDir, "Resources", "HistoricalQuotes.json")
Dim text = File.ReadAllText(quotesPath)
Dim jsonSerializer = New JavaScriptSerializer()
dt = jsonSerializer.Deserialize(Of List(Of Quote))(text)
count = Math.Min(count, dt.Count)
Return dt.Take(count).ToList()
End FunctionSee Also
Working with FinancialChart: Simple Candlesticks, Legends, Markers, Trend Lines, and Annotations