
Floating Bar Chart
Floating bar charts are charts with a single or multiple bars floating between a minimum and maximum value instead of being connected to the axis. It displays information as a range of data by plotting two Y-values(low and high) per data point. Floating bars can be useful to show highs and lows in a data set, such as daily high and low temperatures, stock prices, blood pressure readings, etc.
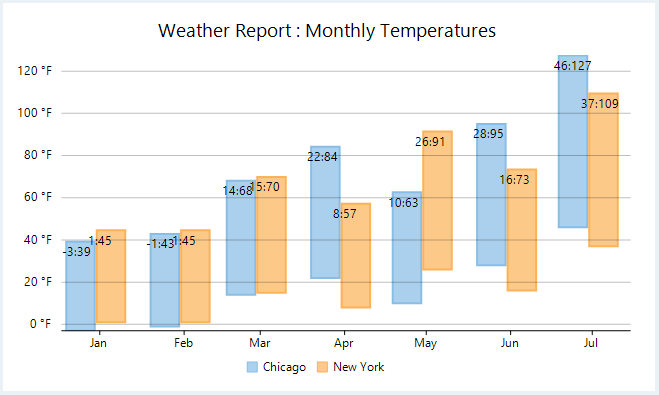
In FlexChart, WinForms floating bar chart can be implemented using the Series class. To begin with, create a new Series object and specify its properties. Then, use the SymbolRendering event provided by the Series class to plot the data points on the chart.
private void Form1_Load(object sender, EventArgs e)
{
    string[] cities = { "Chicago", "New York" };
    List<CityDataItem> data = GetTemperatureData(cities, true, 7, true);
    this.flexChart1.AxisY.Min = data.Select(x => x.Data.Min(y => y.LowTemp)).Min();
    this.flexChart1.AxisY.Max = data.Select(x => x.Data.Max(y => y.HighTemp)).Max();
    foreach (var dataItem in data)
    {
        Series series = new Series()
        {
             series.Binding = "LowTemp,HighTemp";
             series.BindingX = "Date";
             Name = dataItem.Name,
             DataSource = dataItem.Data,
        };
        series.SymbolRendering += Series_SymbolRendering;
        this.flexChart1.Series.Add(series);
    }
    this.flexChart1.DataLabel.Content = "{seriesName}";
    this.flexChart1.DataLabel.Position = LabelPosition.Bottom;
    this.flexChart1.LabelRendering += FlexChart1_LabelRendering;
    this.flexChart1.Header.Content = "Weather Report : Monthly Temperatures";
    this.flexChart1.AxisY.Format = "0 °F";
    this.flexChart1.Options.ClusterSize = new ElementSize { SizeType = ElementSizeType.Percentage, Value = columnWidthPercentage * 100 };
    this.flexChart1.DataLabel.Overlapping = LabelOverlapping.Show;
}
private void FlexChart1_LabelRendering(object sender, RenderDataLabelEventArgs e)
{
    var temp = (Temperature)e.Item;
    e.Text = string.Format("{0:0}:{1:0}", temp.LowTemp, temp.HighTemp);
}
private void Series_SymbolRendering(object sender, RenderSymbolEventArgs e)
{
    e.Cancel = true;
    Temperature temperature = (Temperature)e.Item;
    var width = this.flexChart1.PlotRect.Width / ((List<Temperature>)this.flexChart1.Series[0].DataSource).Count * columnWidthPercentage / this.flexChart1.Series.Count;
    var bottom = 0d;
    bottom = this.flexChart1.AxisY.Convert(temperature.LowTemp);
    e.Engine.DrawRect(e.Point.X - width / 2 - 2, e.Point.Y, width - 4, bottom - e.Point.Y);
}
Private Sub Form1_Load(sender As Object, e As EventArgs) Handles Me.Load
Dim cities As String() = {"Chicago", "New York"}
Dim data As List(Of CityDataItem) = GetTemperatureData(cities, True, 7, True)
'AddressOf Me.flexChart1.AxisY.Min = data.[Select](Function(x) x.Data.Min(Function(y) y.LowTemp)).Min()
'AddressOf Me.flexChart1.AxisY.Max = data.[Select](Function(x) x.Data.Max(Function(y) y.HighTemp)).Max()
For Each dataItem As CityDataItem In data
Dim series As New Series() With {
.series.Binding = "LowTemp,HighTemp";
.series.BindingX = "Date"
.Name = dataItem.Name,
.DataSource = dataItem.Data
}
AddHandler series.SymbolRendering, AddressOf Series_SymbolRendering
Me.flexChart1.Series.Add(series)
Next
Me.flexChart1.DataLabel.Content = "{seriesName}"
Me.flexChart1.DataLabel.Position = LabelPosition.Bottom
AddHandler Me.flexChart1.LabelRendering, AddressOf FlexChart1_LabelRendering
Me.flexChart1.Header.Content = "Weather Report : Monthly Temperatures"
Me.flexChart1.AxisY.Format = "0 °F"
Me.flexChart1.Options.ClusterSize = New ElementSize() With {
.SizeType = ElementSizeType.Percentage,
.Value = columnWidthPercentage * 100
}
Me.flexChart1.DataLabel.Overlapping = LabelOverlapping.Show
End Sub
Private Sub FlexChart1_LabelRendering(sender As Object, e As RenderDataLabelEventArgs)
Dim temp As Temperature = DirectCast(e.Item, Temperature)
e.Text = String.Format("{0:0}:{1:0}", temp.LowTemp, temp.HighTemp)
End Sub
Private Sub Series_SymbolRendering(sender As Object, e As RenderSymbolEventArgs)
e.Cancel = True
Dim temperature As Temperature = DirectCast(e.Item, Temperature)
Dim width As Single = Me.flexChart1.PlotRect.Width / DirectCast(Me.flexChart1.Series(0).DataSource, List(Of Temperature)).Count * columnWidthPercentage / Me.flexChart1.Series.Count
Dim bottom As Double = 0.0
bottom = Me.flexChart1.AxisY.Convert(temperature.LowTemp)
e.Engine.DrawRect(e.Point.X - width / 2 - 2, e.Point.Y, width - 4, bottom - e.Point.Y)
End SubNote that the above sample code uses a custom method named GetTemperatureData to supply data to the chart. You can set up the data source as per your requirements.
private Random rnd = new Random();
public List<CityDataItem> GetTemperatureData(string[] cities, bool monthly = false, int count = 30, bool isFahrenheit = false)
{
    var data = new List<CityDataItem>();
    var startDate = new DateTime(2017, 1, 1);
    foreach (string city in cities)
    {
        var dataItem = new CityDataItem() { Name = city };
        for (int i = 0; i < count; i++)
        {
            var temp = new Temperature();
            DateTime date;
            if (monthly)
                date = startDate.AddMonths(i);
            else
                date = startDate.AddDays(i);
            temp.Date = date;
            if (date.Month <= 8)
                temp.HighTemp = rnd.Next(3 * date.Month, 8 * date.Month);
            else
                temp.HighTemp = rnd.Next((13 - date.Month - 2) * date.Month, (13 - date.Month) * date.Month);
            temp.LowTemp = temp.HighTemp - rnd.Next(6, 8);
            temp.Precipitation = (date.Month < 4 || date.Month > 8) ? rnd.Next(100, 150) : rnd.Next(150, 200);
            if (isFahrenheit) temp.HighTemp = temp.HighTemp * 1.8 + 32;
            dataItem.Data.Add(temp);
        }
        data.Add(dataItem);
    }
    return data;
}
Private rnd As New Random()
Public Function GetTemperatureData(cities As String(), Optional monthly As Boolean = False, Optional count As Integer = 30, Optional isFahrenheit As Boolean = False) As List(Of CityDataItem)
Dim data As List(Of CityDataItem) = New List(Of CityDataItem)()
Dim startDate As DateTime = New DateTime(2017, 1, 1)
For Each city As String In cities
Dim dataItem As CityDataItem = New CityDataItem() With {
.Name = city
}
For i As Integer = 0 To count - 1
Dim temp As Temperature = New Temperature()
Dim [date] As DateTime
If monthly Then
[date] = startDate.AddMonths(i)
Else
[date] = startDate.AddDays(i)
End If
temp.[Date] = [date]
If [date].Month <= 8 Then
temp.HighTemp = rnd.[Next](3 * [date].Month, 8 * [date].Month)
Else
temp.HighTemp = rnd.[Next]((13 - [date].Month - 2) * [date].Month, (13 - [date].Month) * [date].Month)
End If
temp.LowTemp = temp.HighTemp - rnd.[Next](6, 8)
temp.Precipitation = If(([date].Month < 4 OrElse [date].Month > 8), rnd.[Next](100, 150), rnd.[Next](150, 200))
If isFahrenheit Then
temp.HighTemp = temp.HighTemp * 1.8 + 32
End If
dataItem.Data.Add(temp)
Next
data.Add(dataItem)
Next
Return data
End Function