The following XAML shows how to declare the C1Chart control, set the ChartType, Theme, and Palette properties to define the basic chart appearance. The XAML can be added inside the … tags.
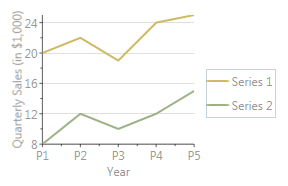
The following chart is produced using the following XAML code:
| XAML |
Copy Code
|
|---|---|
<Window x:Class="WpfApplication1.Window1" xmlns="http://schemas.microsoft.com/winfx/2006/xaml/presentation" xmlns:x="http://schemas.microsoft.com/winfx/2006/xaml" xmlns:c1="http://schemas.componentone.com/xaml/c1chart" Title="Window1" Height="300" Width="348" > <Grid> <!--Declare the C1Chart control Set the ChartType, Theme, and Palette properties to define the basic Chart appearance--> <c1:C1Chart Name="C1Chart1" ChartType="Line" Foreground="#a0000000" Background="#e0ffffff" Theme ="Vista" Palette ="Aspect" > <!--Define the chart View, which contains the chart axes.--> <c1:C1Chart.View> <c1:ChartView> <!-- Define the X axis (title, grid) --> <c1:ChartView.AxisX> <c1:Axis Title="Year" MajorGridStroke="Transparent"/> </c1:ChartView.AxisX> <!-- Define the Y axis (title, grid, annotation format) --> <c1:ChartView.AxisY> <c1:Axis Title="Quarterly Sales (in $1,000)" MajorGridStroke="#40000000" AnnoFormat="n0" /> </c1:ChartView.AxisY> </c1:ChartView> </c1:C1Chart.View> <!--Define the chart Data, which contains the data series.--> <c1:C1Chart.Data> <c1:ChartData> <!-- ItemNames define the labels along the X axis --> <c1:ChartData.ItemNames>P1 P2 P3 P4 P5</c1:ChartData.ItemNames> <!--Each DataSeries specifies a label (shown in the legend) and the series data--> <c1:DataSeries Label="Series 1" RenderMode="Default" Values="20 22 19 24 25" /> <c1:DataSeries Label="Series 2" RenderMode="Default" Values="8 12 10 12 15" /> </c1:ChartData> </c1:C1Chart.Data> <!--Add a ChartLegend, docked to the right of the chart, to display a legend containing the series and their styles.--> <c1:C1ChartLegend DockPanel.Dock="Right" /> </c1:C1Chart> </Grid> </Window> |
|