-
Chart for WPF and Silverlight
- Getting Started
- Concepts and Main Properties
- Chart Types
-
Chart Features
- Animation
- Axis
- Chart Legend
- Chart View
- Data Binding
- Data Point Converter
- Data Labels
- Data Series 1
- Empty Values
- Grouping Aggregation
- Interaction
- Markers Labels
- Multiple Plot Areas
- Performance Optimization
- Plotting Functions
- Saving and Exporting C1Chart
- Series Generation
- Style and Appearance
- Time-Series Charts
- Trend Lines
- Tutorials
Empty Values
By default, if there is a hole(double.NaN) in data values chart just skips the value and draws line to next valid data point.
To change this behavior and show the gaps at the hole values, set Display = ShowNaNGap.
For example, the following XAML code includes specified holes in the DataSeries:
<c1chart:C1Chart  Name="c1Chart1" ChartType="Line">
     <c1chart:C1Chart.Data>
       <c1chart:ChartData>
         <c1chart:DataSeries Values="20 22 NaN 24 15 NaN 27 26"
           ConnectionStrokeThickness="3" />
       </c1chart:ChartData>
     </c1chart:C1Chart.Data>
   </c1chart:C1Chart>
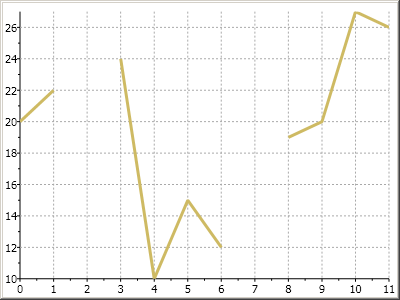
The chart appears similar to the following without the Display property set:
To show a gap between the chart lines in a Line chart you can set the Display property to ShowNaNGap like the following:
Me.C1Chart1.Data.Children(1).Display = C1.WPF.C1Chart.SeriesDisplay.ShowNaNGap
this.C1Chart1.Data.Children[1].Display = C1.WPF.C1Chart.SeriesDisplay.ShowNaNGap;
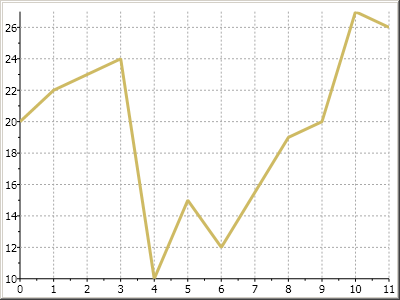
The line chart will display a gap between the chart lines, similar to the following: