-
Chart for WPF and Silverlight
- Getting Started
- Concepts and Main Properties
- Chart Types
-
Chart Features
- Animation
- Axis
- Chart Legend
- Chart View
- Data Binding
- Data Point Converter
- Data Labels
- Data Series 1
- Empty Values
- Grouping Aggregation
- Interaction
- Markers Labels
- Multiple Plot Areas
- Performance Optimization
- Plotting Functions
- Saving and Exporting C1Chart
- Series Generation
- Style and Appearance
- Time-Series Charts
- Trend Lines
- Tutorials
Multiple Plot Areas
The data is plotted in the plot area of the chart. The Plot area is the part of the plot limited by axes and containing all plot elements (bars, columns, lines etc.). Previously, the chart can have only one plot area but now it's possible to have several ones in the same chart.
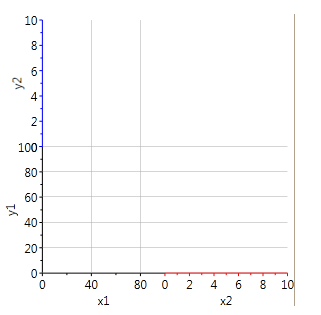
Usually plot areas are created automatically based on PlotAreaIndex property. By default it's 0 and the new plot area is not created for the additional axis. Axis is just added for example, at the left of main y-axis or at the bottom of the main x-axis. But if you set PlotAreaIndex = 1 the new axis is added on the same line as the main axis. For x-axis the auxiliary axis will be at the right and for y-axis - at the top.
The following example illustrates the new axis added on the same line as the main axis:

<c1chart:C1Chart x:Name="chart" >
       <c1chart:C1Chart.View>
         <c1chart:ChartView>
           <!-- Main axes  -->
           <c1chart:ChartView.AxisX>
             <c1chart:Axis Min="0" Max="100" Title="x1" />
           </c1chart:ChartView.AxisX>
           <c1chart:ChartView.AxisY>
             <c1chart:Axis Min="0" Max="100" Title="y1" />
           </c1chart:ChartView.AxisY>
           <!-- Auxiliary axis at the right of main x-axis -->
           <c1chart:Axis x:Name="x2" Title="x2" PlotAreaIndex="1"
              AxisType="X" Min="0" Max="10" />
           <!-- Auxiliary axis at the top of main x-axis -->
           <c1chart:Axis x:Name="y2" Title="y2" PlotAreaIndex="1"
              AxisType="Y" Min="0" Max="10" />
         </c1chart:ChartView>
       </c1chart:C1Chart.View>
     </c1chart:C1Chart>
To add the data you need to specify the name of the axis (DataSeries.AxisX/AxisY) and the data will be plotted along the auxiliary axis.


