
-
Chart for WPF and Silverlight
- Getting Started
- Concepts and Main Properties
- Chart Types
- Chart Features
- Tutorials
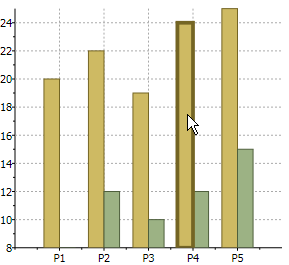
Creating a Mouse Click Event for a Column Chart
You can add animation when you click on any column in the Column chart, using MouseDown and MouseLeave events, like the following XAML markup:
<Window x:Class="MouseEvent.Window1"
    xmlns="http://schemas.microsoft.com/winfx/2006/xaml/presentation"
    xmlns:x="http://schemas.microsoft.com/winfx/2006/xaml"
          xmlns:sys="clr-namespace:System;assembly=mscorlib"
    Title="Window1" Height="300" Width="300" xmlns:c1chart="http://schemas.componentone.com/xaml/c1chart" Loaded="Window_Loaded">
    <Grid>
        <Grid.Resources>
            <Style x:Key="sstyle" TargetType="{x:Type c1chart:PlotElement}">
                <Setter Property="StrokeThickness" Value="1" />
                <Setter Property="Canvas.ZIndex" Value="0" />
                <Style.Triggers>
                    <EventTrigger RoutedEvent="c1chart:PlotElement.MouseDown">
                        <BeginStoryboard>
                            <Storyboard>
                                <Int32Animation Storyboard.TargetProperty="(Panel.ZIndex)"
                             To="1" />
                                <DoubleAnimation Storyboard.TargetProperty="StrokeThickness"
                            To="4" Duration="0:0:0.3"
                              AutoReverse="True"
                             RepeatBehavior="Forever" />
                            </Storyboard>
                        </BeginStoryboard>
                    </EventTrigger>
                    <EventTrigger RoutedEvent="c1chart:PlotElement.MouseLeave">
                        <BeginStoryboard>
                            <Storyboard>
                                <DoubleAnimation
Storyboard.TargetProperty="StrokeThickness" />
                                <Int32Animation Storyboard.TargetProperty="(Panel.ZIndex)" />
                            </Storyboard>
                        </BeginStoryboard>
                    </EventTrigger>
                </Style.Triggers>
            </Style>
        </Grid.Resources>
        <c1chart:C1Chart Margin="0" Name="c1Chart1" ChartType="Column">
            <c1chart:C1Chart.Data>
                <c1chart:ChartData>
                    <c1chart:ChartData.ItemNames>P1 P2 P3 P4 P5</c1chart:ChartData.ItemNames>
                    <c1chart:DataSeries SymbolStyle="{StaticResource sstyle}" Values="20
22 19 24 25" />
                    <c1chart:DataSeries SymbolStyle="{StaticResource sstyle}" Values="8
12 10 12 15" />
                </c1chart:ChartData>
            </c1chart:C1Chart.Data>
        </c1chart:C1Chart>
    </Grid>
</Window>
This Topic Illustrates the Following:
Click on any of the columns and notice the animation around the borders of the rectangles:
See Also
Specifying the Color of Each Bar Or Column in the Data Series