
Scatter Charts
The XYPlot is also known as a Scatter plot chart.
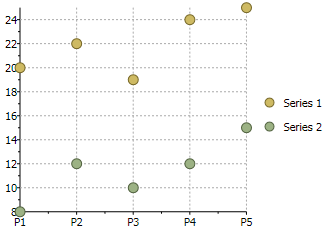
The following image represents the XYPlot chart when you set the ChartType property to XYPlot:
[]
The XYPlot is also known as a Scatter plot chart.
The following image represents the XYPlot chart when you set the ChartType property to XYPlot: