-
Chart for WPF and Silverlight
- Getting Started
- Concepts and Main Properties
- Chart Types
- Chart Features
- Tutorials
HighLowOpenClose Chart
The difference between common chart types and financial charts is that HighLowOpenClose charts require a special type of data series object, the HighLowOpenCloseSeries. In this type of data series, each point corresponds to a period (typically one day) and contains five values:
- Time
- Price at the beginning of period (Open)
- Price at the end of period (Close)
- Minimum price during period (Low)
- Maximum price during period (High)
- To create financial charts you need to provide all these values.
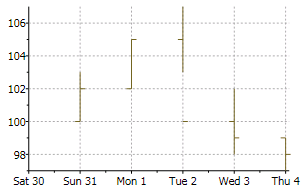
The following image represents the HighLowOpenClose chart when you set ChartType property to HighLowOpenClose and specify the data values for the XValues, HighValues, LowValues, OpenValues, and CloseValues, like the following:
<c1chart:C1Chart ChartType="HighLowOpenClose">
    <c1chart:C1Chart.Data>
      <c1chart:ChartData>
        <c1chart:HighLowOpenCloseSeries
            XValues="1 2 3 4 5"
           HighValues="103 105 107 102 99"
           LowValues="100 99 101 98 97"
           OpenValues="100 100 105 100 99"
           CloseValues="102 103 103 99 98"
         />
      </c1chart:ChartData>
    </c1chart:C1Chart.Data>
  </c1chart:C1Chart>