Selection
Selection in charts helps the end-user to select the required data point or the whole series at run-time during analysis, etc.
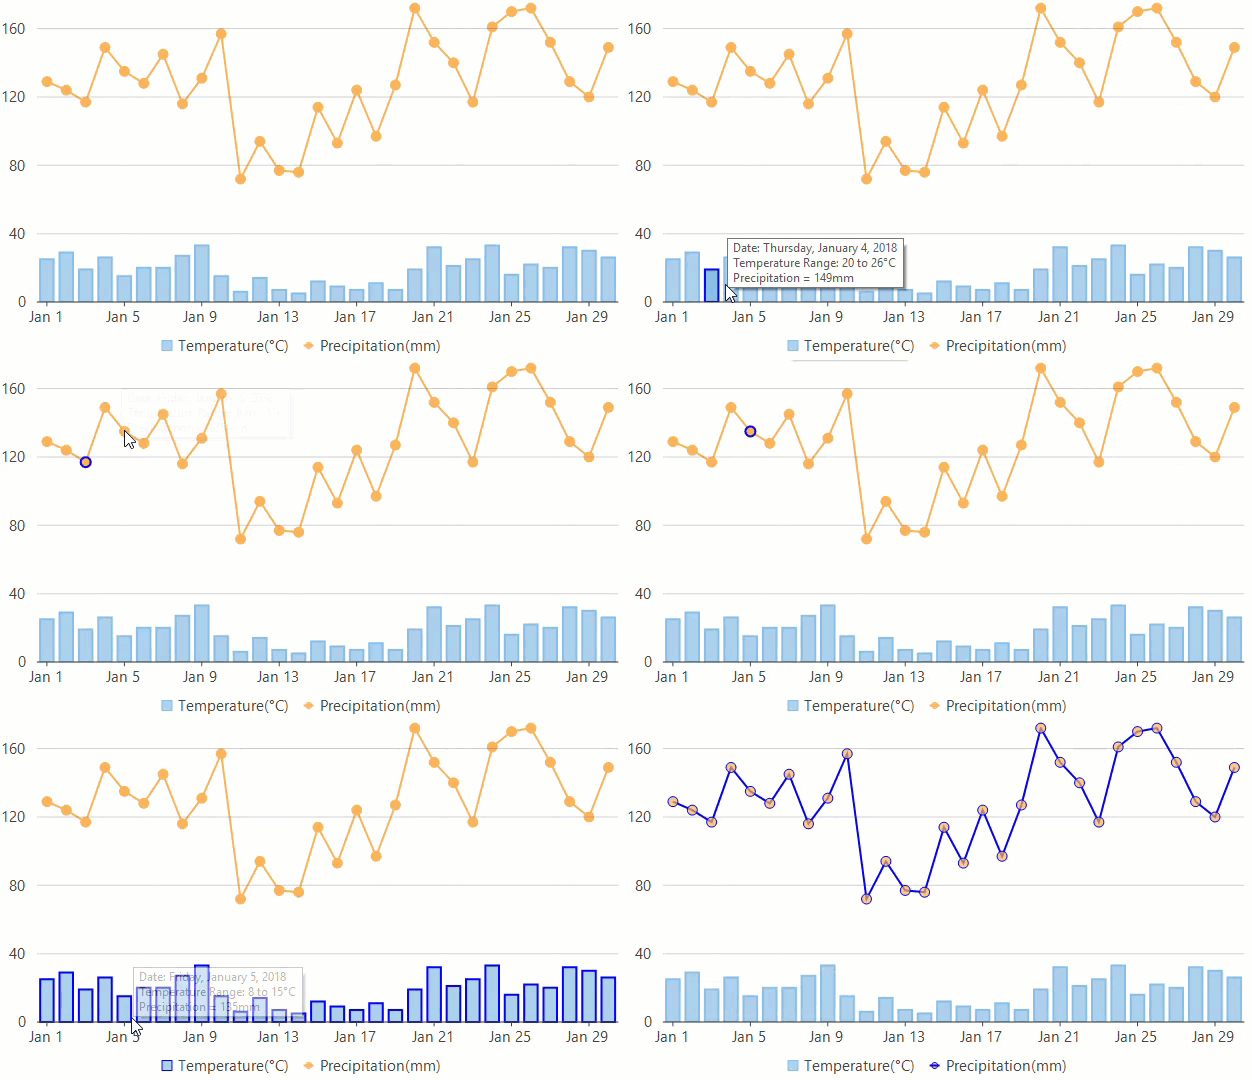
In FlexChart, selection is disabled by default. However, you can enable the same by setting the SelectionMode property which accepts value from ChartSelectionMode enumeration. You can choose to enable the point or series selection by setting value of this property to Point or Series respectively. Note that there are some exceptions and some of the charts like pie chart, sunburst chart and treemap do not have any effect when this property is set to Series. Similarly, in case of simple line charts and financial charts, setting the value to Point does not reflect any change in the run-time functionality.

FlexChart also lets you get or set the index of the selected item using the SelectedIndex property. Moreover, it provides a SelectionChanged event which notifies when the selected point or series is changed so that you can customize the selection process according to the requirements.
By default, FlexChart highlights the selection through a red colored solid line. However, you can also customize how a selected item should appear by using the SelectionStyle property. The property is of ChartStyle type and lets you change the fill, fill color, stroke, stroke color, line pattern etc.
//Set selection specific properties
this.flexChart1.SelectionMode = ChartSelectionMode.Series;
this.flexChart1.SelectedIndex = 2;
this.flexChart1.SelectionStyle.StrokeColor = Color.Blue;
this.flexChart1.SelectionStyle.StrokeWidth = 2;
'Set selection specific properties
Me.flexChart1.SelectionMode = ChartSelectionMode.Series
Me.flexChart1.SelectedIndex = 2
Me.flexChart1.SelectionStyle.StrokeColor = Color.Blue
Me.flexChart1.SelectionStyle.StrokeWidth = 2Apart from the abovementioned common settings related to selection, some chart types like pie chart, sunburst chart and treemap have some chart specific properties as well which are discussed in the sections below.
Selection in Pie and Sunburst Chart
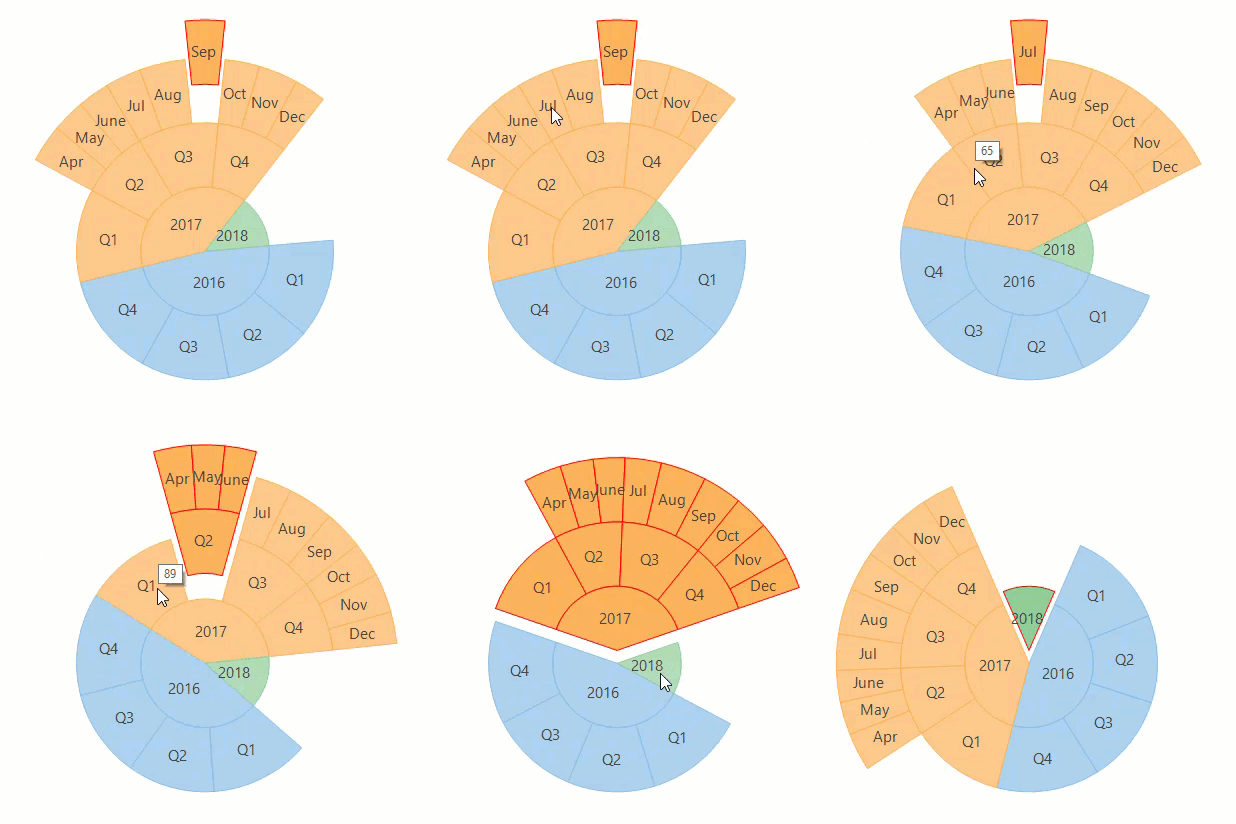
Pie and sunburst chart, being different from usual charts have some properties that are specific to them and help in enhancing the end user experience. When SelectionMode property is set to Point, by default, the charts highlight the selected slice with a red colored line. However, to give it an additional impact, you can even set SelectedItemOffset so that the selected slice displays away from rest of the chart. The FlexPie class also provides a SelectedItemPosition property which lets you choose to display the position of selected slice. That is, when you select a particular slice, the charts rotate to always display the selected slice in your chosen position, on top, bottom, right, left etc.

//Set selection specific properties
flexPie1.SelectionMode = ChartSelectionMode.Point;
flexPie1.SelectedItemOffset = 0.2;
flexPie1.SelectedItemPosition = Position.Top;
'Set selection specific properties
flexPie1.SelectionMode = ChartSelectionMode.Point
flexPie1.SelectedItemOffset = 0.2
flexPie1.SelectedItemPosition = Position.TopSelection in TreeMap
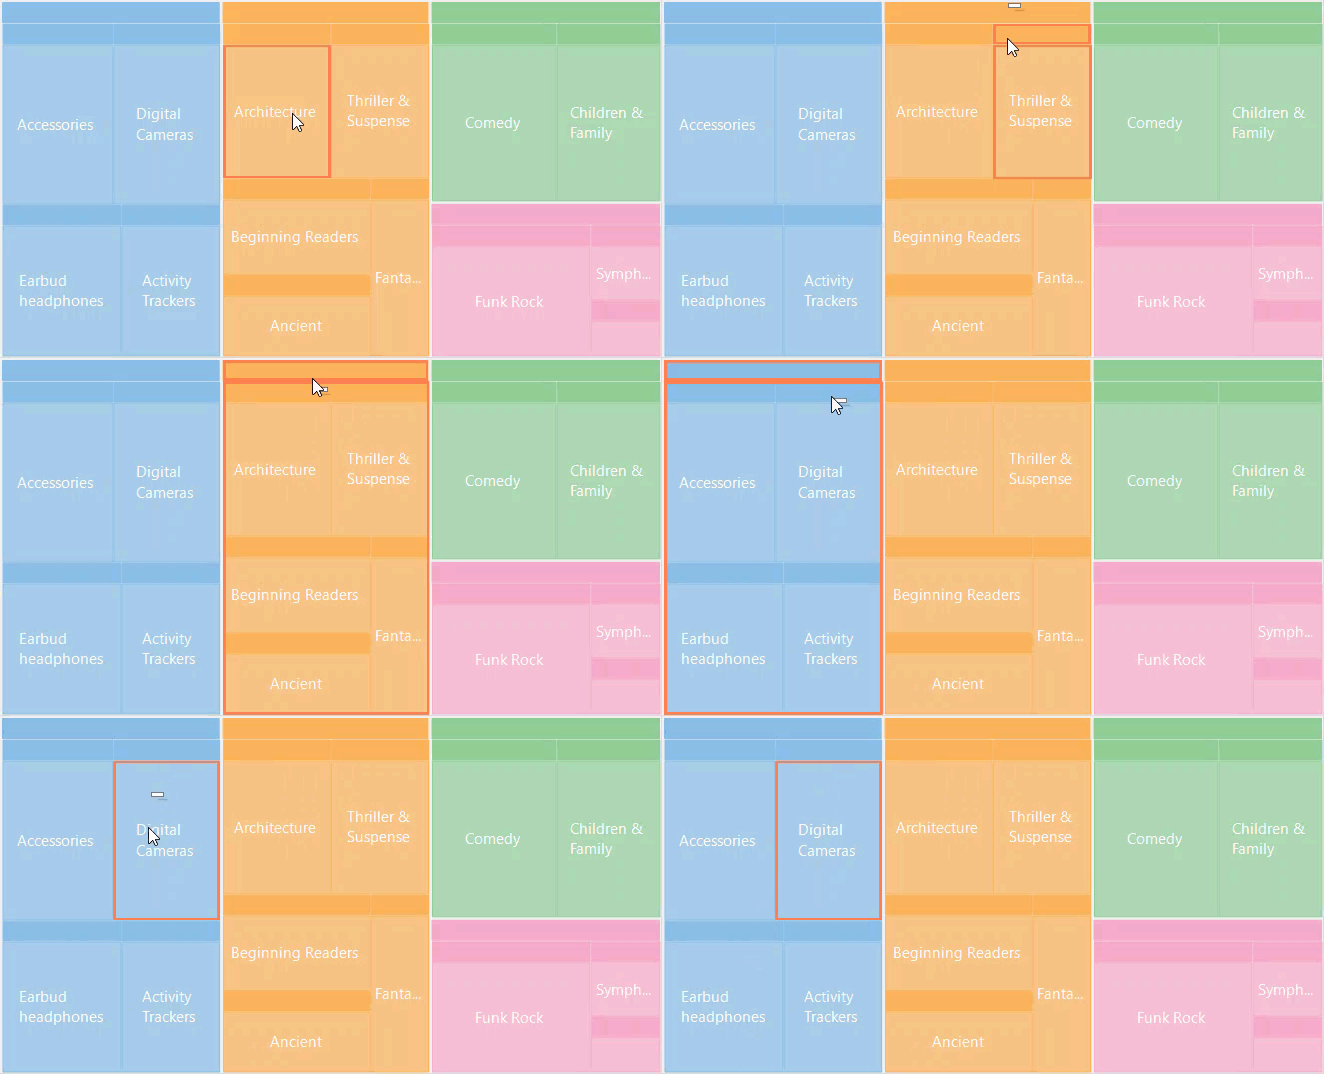
TreeMap lets you select the individual data items or groups by simply clicking on them. Other than the common properties mentioned above, the TreeMap class also provides the SelectedItem property which lets you get or set the selected data item.

//Set selection specific properties
treeMap1.SelectionMode = ChartSelectionMode.Point;
treeMap1.SelectionStyle.StrokeColor = Color.Coral;
treeMap1.SelectionStyle.StrokeWidth = 2;
treeMap1.SelectedItem = (treeMap1.DataSource as object[])[2];
'Set selection specific properties
treeMap1.SelectionMode = ChartSelectionMode.Point
treeMap1.SelectionStyle.StrokeColor = Color.Coral
treeMap1.SelectionStyle.StrokeWidth = 2
treeMap1.SelectedItem = TryCast(treeMap1.DataSource, Object())(2)

