Scroll
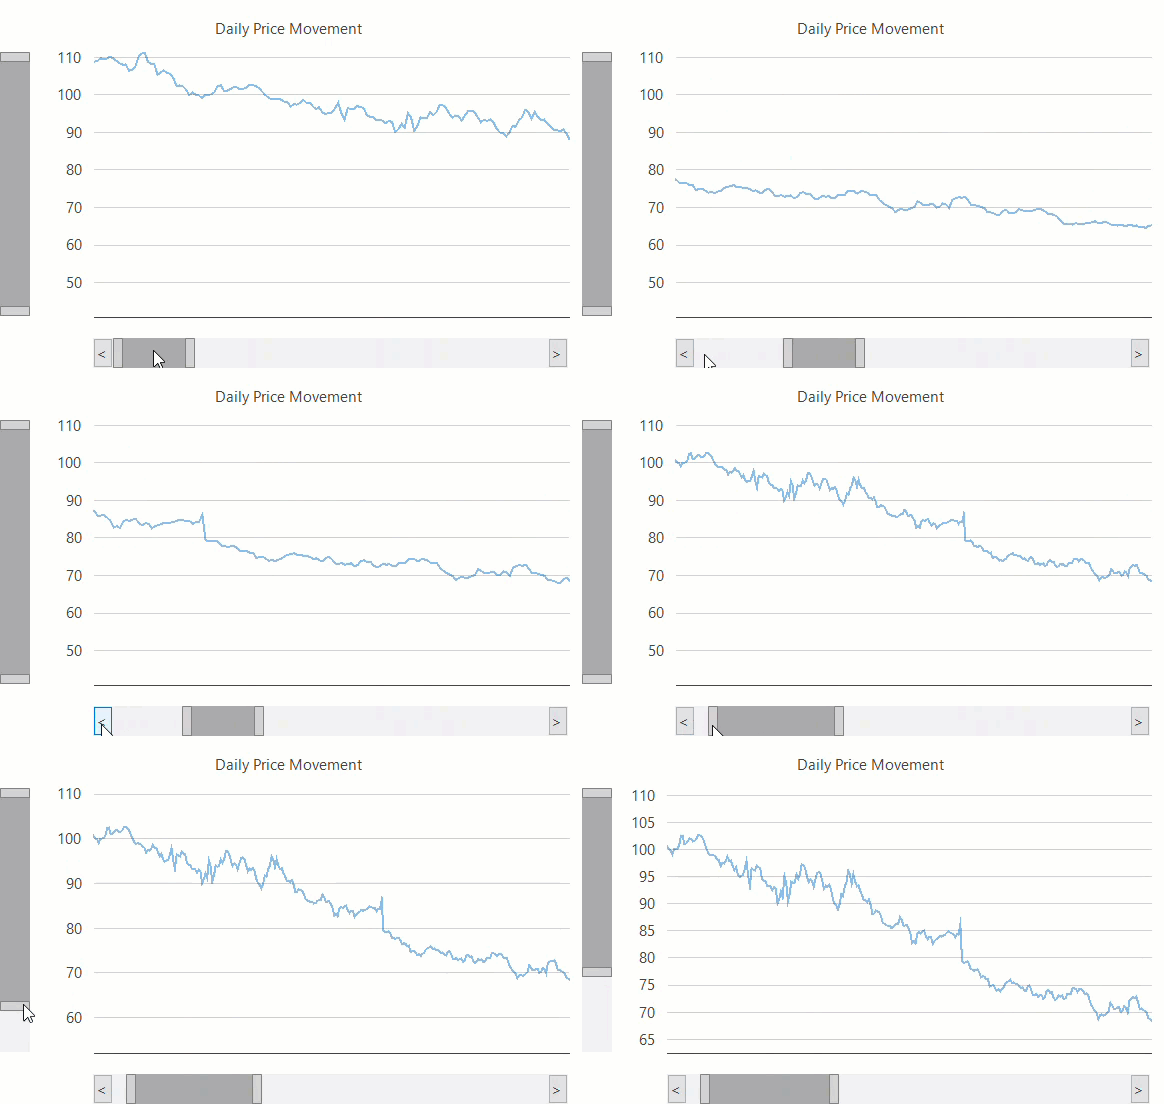
Scrolling in charts comes into picture when huge amount of data needs to be plotted in a limited space but requires detailed analysis. This feature provides end-user with an ability to focus on analysis of the selected range of values instead of the whole data. For instance, while presenting the daily price movement of a stock across an year, axis scroll bars can enable end-user to focus on movement of data in a month or even a week.

FlexChart allows you to add scroll bars to X-axis as well as Y-axis by using AxisScrollBar class of C1.Win.Chart.Interaction namespace. To attach a scroll bar to an axis in FlexChart, you need to create an instance of the AxisScrollBar class and pass an Axis object as a parameter to it. By default, the scroll bar gets displayed with two thumbs that define the range of current selection using the UpperValue and LowerValue properties. The upper and lower value changes when user drags these thumbs at run-time and a ValueChanged event is fired. A scroll bar also consists of two scroll buttons on extreme ends which when clicked helps the end-user to scroll the selected range. You can choose to hide these buttons by setting the ScrollButtonsVisible property to False.
flexChart1.Rendering += (s, e) =>
{
    if (_horizontalScrollbar != null && _verticalScrollbar != null)
        return;
    //Creating instance of ScrollBar and attaching it to AxisX
    _horizontalScrollbar = new C1.Win.Chart.Interaction.AxisScrollbar(flexChart1.AxisX);
    //Setting upper value of ScrollBar
    _horizontalScrollbar.UpperValue = _horizontalScrollbar.LowerValue + 150;
    //Creating instance of ScrollBar and attaching it to AxisY
    _verticalScrollbar = new C1.Win.Chart.Interaction.AxisScrollbar(flexChart1.AxisY);
    //Hide ScrollBar buttons
    _verticalScrollbar.ScrollButtonsVisible = false;
};
AddHandler flexChart1.Rendering, Function(s, e)
If _horizontalScrollbar IsNot Nothing AndAlso _verticalScrollbar IsNot Nothing Then
Return Nothing
End If
_horizontalScrollbar = New C1.Win.Chart.Interaction.AxisScrollbar(flexChart1.AxisX)
_horizontalScrollbar.UpperValue = _horizontalScrollbar.LowerValue + 150
_verticalScrollbar = New C1.Win.Chart.Interaction.AxisScrollbar(flexChart1.AxisY)
_verticalScrollbar.ScrollButtonsVisible = False
End FunctionAxis Scrollbar position
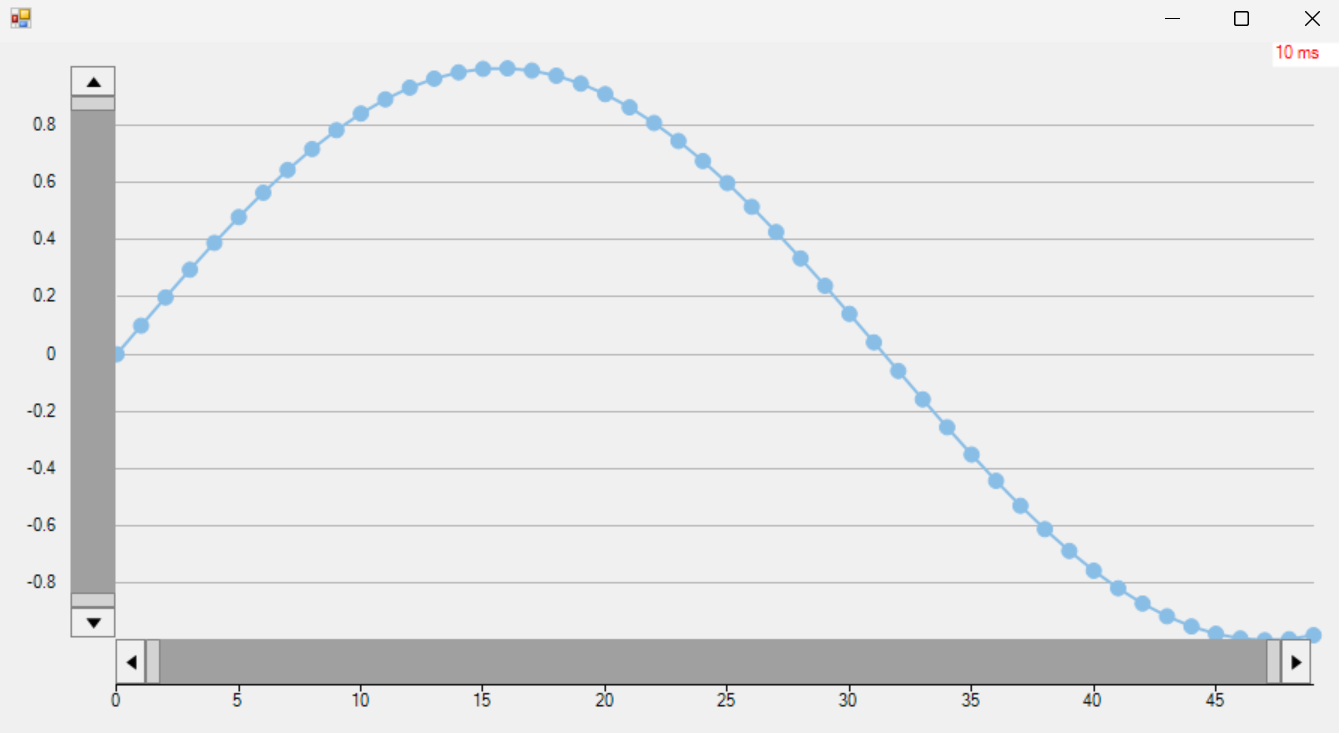
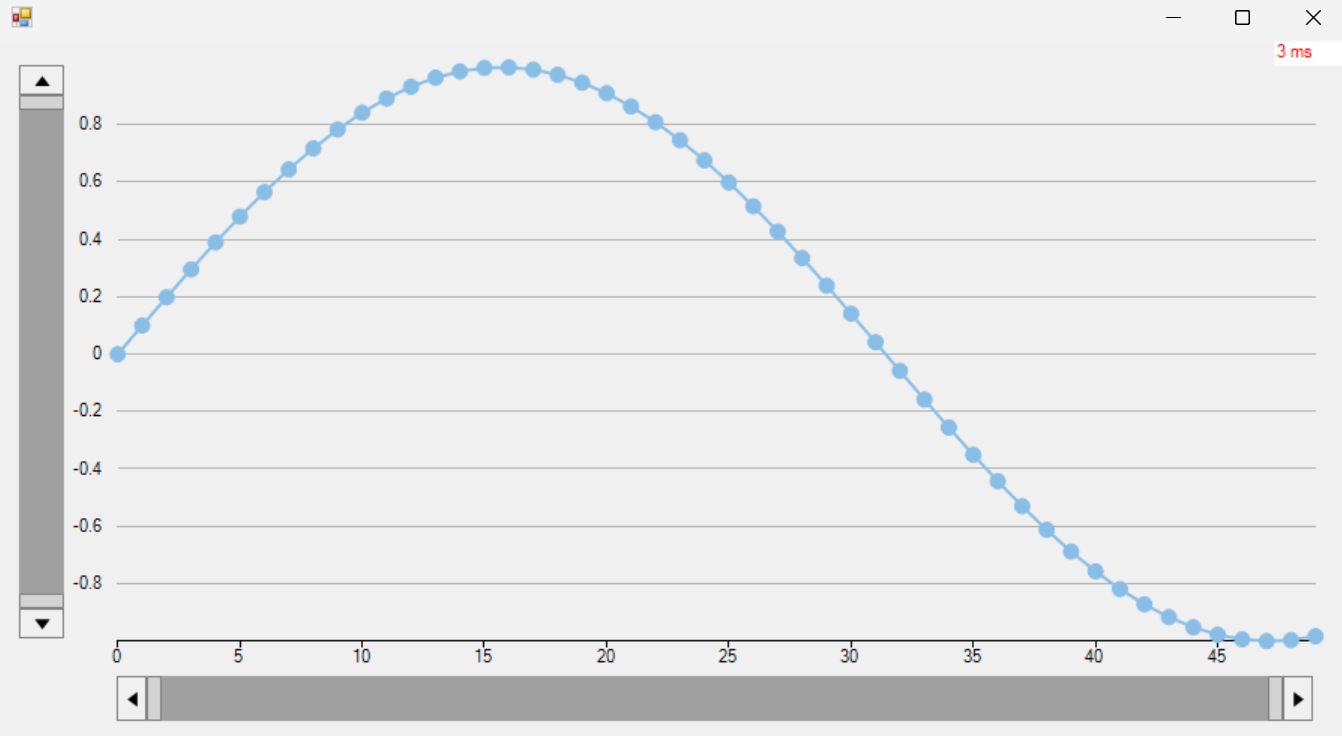
The Axis Scrollbar Position feature allows users to configure the placement of the scrollbar along a chart axis in FlexChart, allowing it to appear either inside or outside the axis area.
Inside the Axis

Outside the Axis

The following code demonstrates how to define the position of the Axis Scrollbar.
var sbx = new C1.Win.Chart.Interaction.AxisScrollbar(chart.AxisX);
var sby = new C1.Win.Chart.Interaction.AxisScrollbar(chart.AxisY);
sbx.Position = C1.Win.Chart.Interaction.AxisScrollbar.ScrollbarPosition.Outside;
sby.Position = C1.Win.Chart.Interaction.AxisScrollbar.ScrollbarPosition.Outside;

