Zoom and Pan
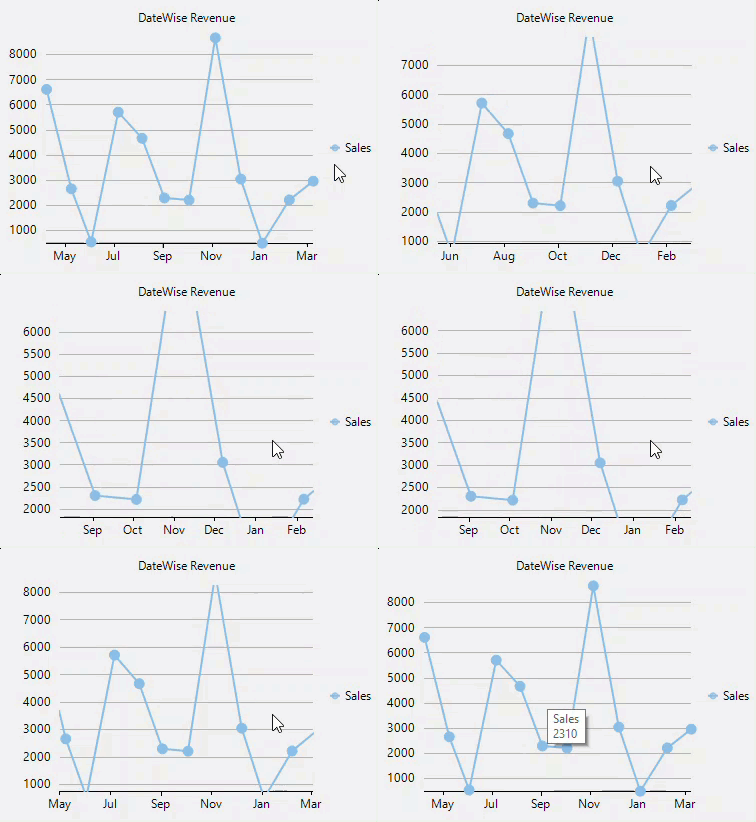
Zooming in charts allows users to enlarge a specific area enabling them to analyze the data packed charts at granular level. FlexChart supports zooming through the ZoomBehavior class. To implement zooming, create an instance of the ZoomBehavior class available in C1.Win.Chart.Interaction namespace and add it to the FlexChart's behavior collection using the Add method. This integrates zoom behavior to the FlexChart on scroll of the mouse wheel or Pinch-In and Pinch-Out for touch-based input within the chart area.
The following GIF shows the zoom behavior of FlexChart.

The following code example illustrates adding zooming behavior in FlexChart. This example uses the sample created in Quick Start section:
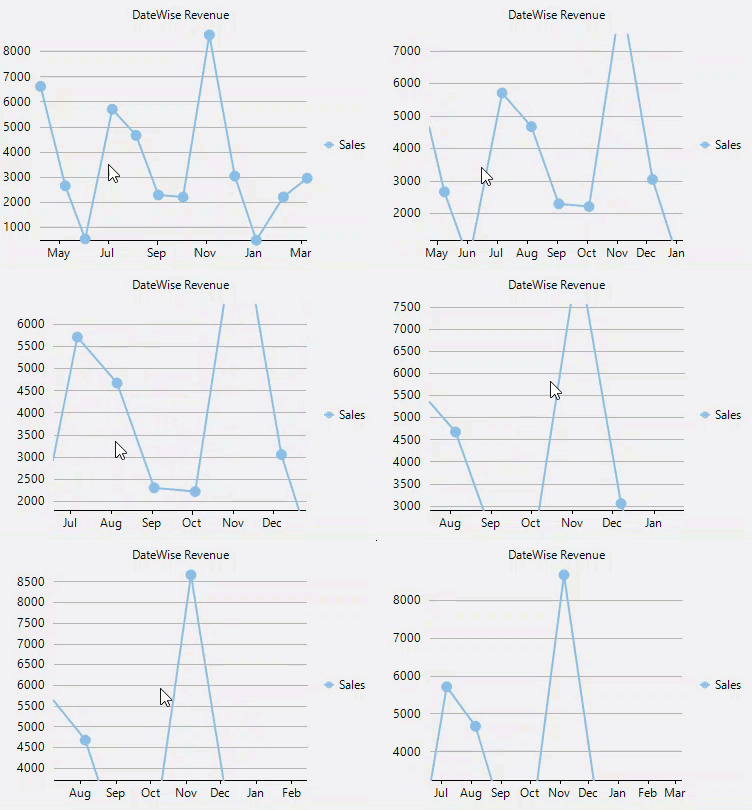
flexChart1.Behaviors.Add(new C1.Win.Chart.Interaction.ZoomBehavior());FlexChart1.Behaviors.Add(New C1.Win.Chart.Interaction.ZoomBehavior())Similarly, panning is the ability to scroll or move within a zoomed image. Panning in FlexChart can be implemented by creating an instance of the TranslateBehavior class available in the C1.Win.Chart.Interaction namespace and adding it to the FlexChart's Behaviors collections using the Add method.
The below GIF shows translate behavior in FlexChart.

The following code example illustrates adding translate behavior in FlexChart. This example uses the sample created in Quick Start section:
flexChart1.Behaviors.Add(new C1.Win.Chart.Interaction.TranslateBehavior());FlexChart1.Behaviors.Add(New C1.Win.Chart.Interaction.TranslateBehavior())Additionally, the Chart , MaxZoom, and Mode properties can be used with zoom and translate behaviors as discussed in the below table:
Option | Description | |
|---|---|---|
Chart | Attach the behavior with specific chart. | |
MaxZoom | Set the max zoom level for Zoom behavior for the chart. By default, the value is 10000. | |
Mode | Enables touch based zooming and panning by setting the gesture direction through the GestureMode enumeration, that provides four modes as detailed below : None - Disables zooming and panning. X - Enables zooming along x-axis. Y - Enables zooming along y-axis. XY - Enables zooming along both x and y axes. | |
The following code illustrates Chart, MaxZoom and Mode properties used with the Zoom and Translate behaviors:
flexChart1.Behaviors.Add(new C1.Win.Chart.Interaction.ZoomBehavior { Chart = flexChart1, MaxZoom = 200, Mode = GestureMode.XY});
flexChart1.Behaviors.Add(new C1.Win.Chart.Interaction.TranslateBehavior { Chart = flexChart1, Mode = GestureMode.XY });FlexChart1.Behaviors.Add(New C1.Win.Chart.Interaction.ZoomBehavior With {
.Chart = FlexChart1,
.MaxZoom = 200,
.Mode = GestureMode.XY})
FlexChart1.Behaviors.Add(New C1.Win.Chart.Interaction.TranslateBehavior With {
.Chart = FlexChart1,
.Mode = GestureMode.XY})

