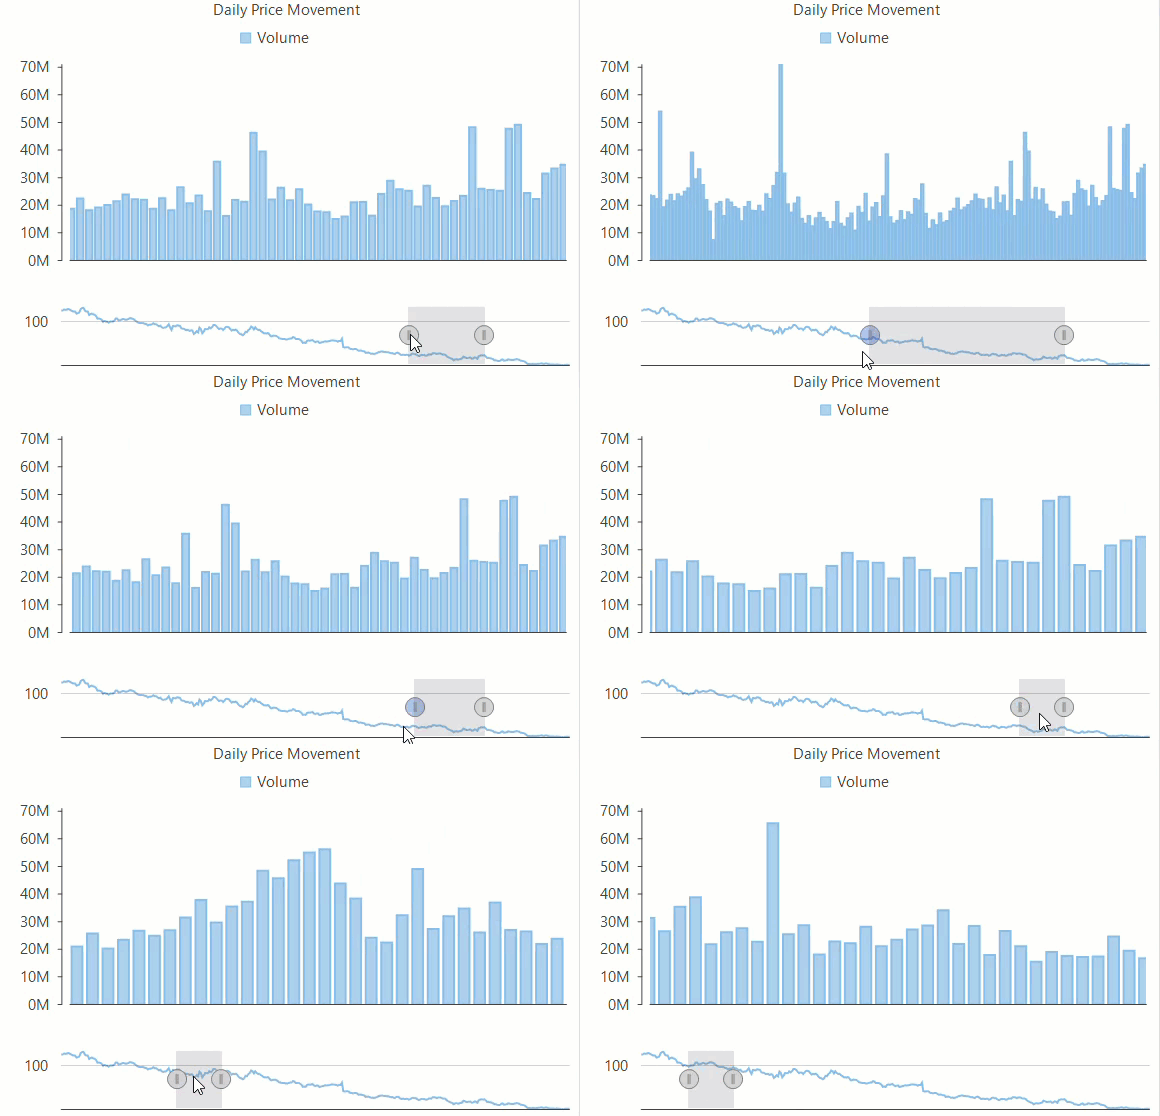
Range Selector
Range selector is a modern approach of scrolling the charts with huge data. In this case, instead of usual scroll bars, another broad view chart is displayed so that end-user can select the desired range more precisely and effectively. Just like axis scroll bars, range selector also acts as a tool for end-user for analyzing the selected range of data in detail. Analysis of stock charts is one of the good use case example of a range selector.

FlexChart provides the RangeSelector class of C1.Win.Chart.Interaction namespace to implement a range selector. To add range selector to a chart, you need to create two instances of the FlexChart class, one for selecting the range and other for displaying the selected range. Set up the two charts and finally, pass the instance of the range selector FlexChart to the RangeSelector class. By default, the range selector gets displayed with two thumbs that define the range of current selection using the UpperValue and LowerValue properties. The upper and lower value changes when user drags these thumbs at run-time and a ValueChanged event is fired.
private void SetupRangeSelector()
{
    if (_rsXRangeSelector != null)
        return;
    _rsXRangeSelector = new C1.Win.Chart.Interaction.RangeSelector(_fcChartRangeSelector);
    //Handle event so axis values change as range selection changes
    _rsXRangeSelector.ValueChanged += (s, e) =>
    {
        flexChart1.AxisX.Min = _rsXRangeSelector.LowerValue;
        flexChart1.AxisX.Max = _rsXRangeSelector.UpperValue;
    };
    _rsXRangeSelector.LowerValue = _rsXRangeSelector.UpperValue - 90;
}
Private Sub SetupRangeSelector()
If _rsXRangeSelector IsNot Nothing Then
Return
End If
_rsXRangeSelector = New C1.Win.Chart.Interaction.RangeSelector(_fcChartRangeSelector)
'Handle event so axis values change as range selection changes
AddHandler _rsXRangeSelector.ValueChanged, Function(s, e)
flexChart1.AxisX.Min = _rsXRangeSelector.LowerValue
flexChart1.AxisX.Max = _rsXRangeSelector.UpperValue
End Function
_rsXRangeSelector.LowerValue = _rsXRangeSelector.UpperValue - 90
End SubIn this example, set up of the two charts has been done in the following way:
// Method for initializing FlexChart
protected void SetupChart()
{
    //Getting data
    var data = GetQuotes();
    //Getting the lowest/highest quote price
    var minPrice = data.Min((q) => q.Low);
    var maxPrice = data.Max((q) => q.High);
    //Sorting data by Volume
    var orderedVolume = data.OrderBy((q) => q.Volume);
    flexChart1.Series.Clear();
    //Setting FlexChart's Header
    this.flexChart1.Header.Content = "Daily Price Movement";
    //Passing data in FlexChart
    this.flexChart1.DataSource = data;
    //Binding chart's AxisX to 'Date' so dates appear in Horizontal axis
    this.flexChart1.BindingX = "Date";
    //Binding FlexChart to 'Volume' so their market share appears in Vertical axis
    var _sVolume = new Series
    {
        Name = "Volume",
        Binding = "Volume",
        AxisY = new Axis { Position = Position.Left, Format = "#,##0,,M" },
    };
    this.flexChart1.Series.Add(_sVolume);
    this.flexChart1.AxisY.Min = 2 * minPrice - maxPrice;
    //Positioning legend's at Top since as there axes at both left, right of FlexChart
    this.flexChart1.Legend.Position = Position.Top;
    #region setuprangeselector
    //Setup Range Selector Chart

    //Setting ChartType for RangeSelection chart
    _fcChartRangeSelector.ChartType = ChartType.Line;
    //Passing data in RangeSelection chart
    _fcChartRangeSelector.DataSource = this.flexChart1.DataSource;
    //Binding chart's AxisX to 'Date' so dates appear in Horizontal axis
    _fcChartRangeSelector.BindingX = "Date";
    //Adding a new Series for High quote, hence binding it to "High" field
    _fcChartRangeSelector.Series.Add(new Series { Binding = "High" });
    _fcChartRangeSelector.Rendered += (s, e) =>
    {
        SetupRangeSelector();
    };
' Method for initializing FlexChart
Protected Sub SetupChart()
'Getting data
Dim data As List(Of Quote) = GetQuotes()
'Getting the lowest/highest quote price
Dim minPrice As Double = data.Min(Function(q) q.Low)
Dim maxPrice As Double = data.Max(Function(q) q.High)
'Sorting data by Volume
Dim orderedVolume As IOrderedEnumerable(Of Quote) = data.OrderBy(Function(q) q.Volume)
flexChart1.Series.Clear()
'Setting FlexChart's Header
Me.flexChart1.Header.Content = "Daily Price Movement"
'Passing data in FlexChart
Me.flexChart1.DataSource = data
'Binding chart's AxisX to 'Date' so dates appear in Horizontal axis
Me.flexChart1.BindingX = "Date"
'Binding FlexChart to 'Volume' so their market share appears in Vertical axis
Dim _sVolume As Series = New Series() With {
.Name = "Volume",
.Binding = "Volume",
.AxisY = New Axis() With {
.Position = Position.Left,
.Format = "#,##0,,M"
}
}
Me.flexChart1.Series.Add(_sVolume)
Me.flexChart1.AxisY.Min = 2 * minPrice - maxPrice
'Positioning legend's at Top since as there axes at both left, right of FlexChart
Me.flexChart1.Legend.Position = Position.Top
'#Region "setuprangeselector"
'Setup Range Selector Chart
'Setting ChartType for RangeSelection chart
_fcChartRangeSelector.ChartType = ChartType.Line
'Passing data in RangeSelection chart
_fcChartRangeSelector.DataSource = Me.flexChart1.DataSource
'Binding chart's AxisX to 'Date' so dates appear in Horizontal axis
_fcChartRangeSelector.BindingX = "Date"
'Adding a new Series for High quote, hence binding it to "High" field
_fcChartRangeSelector.Series.Add(New Series() With {
.Binding = "High"
})
AddHandler _fcChartRangeSelector.Rendered, Function(s, e)
SetupRangeSelector()
End Function

