
Plot Area
Plot area is the area of chart where data points are plotted. In a chart having X and Y axis, plot area also refers to the area covered by the axes. In a chart like pie chart or sunburst chart, plot area refers to the circular area actually covered by the chart itself.
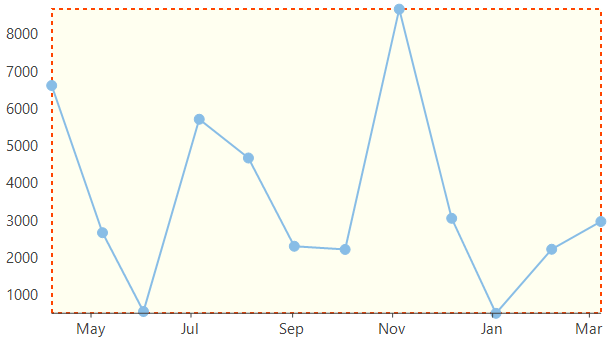
In FlexChart, plot area is rendered with a basic white background color. However, you can customize the appearance of plot area to match your requirements using PlotStyle property of ChartStyle type. The ChartStyle class provides properties to set fill, fill color, line pattern, stroke, stroke width, stroke dash pattern etc.
//Setting color that fills the plot area
this.flexChart1.PlotStyle.Fill = new SolidBrush(Color.Ivory) ;
//Setting brush to be used for stroke pattern
this.flexChart1.PlotStyle.Stroke = Brushes.OrangeRed;
//Setting width to be used for stroke pattern
this.flexChart1.PlotStyle.StrokeWidth = 2.0f;
//Setting pattern to be used stroke
this.flexChart1.PlotStyle.LinePattern = C1.Chart.LinePatternEnum.Dash;
'Setting color that fills the plot area
Me.flexChart1.PlotStyle.Fill = New SolidBrush(Color.LightGray)
'Setting brush to be used for stroke pattern
Me.flexChart1.PlotStyle.Stroke = Brushes.DarkBlue
'Setting width to be used for stroke pattern
Me.flexChart1.PlotStyle.StrokeWidth = 2.0F
'Setting pattern to be used stroke
Me.flexChart1.PlotStyle.LinePattern = C1.Chart.LinePatternEnum.DashCreate Multiple Plot Areas
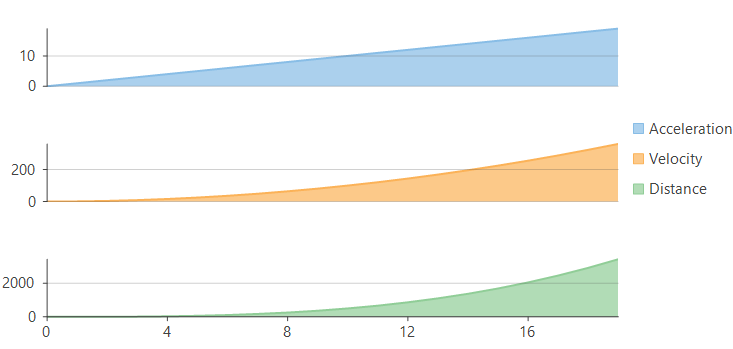
Multiple plot areas are advantageous over multiple overlapped series as they increase the readability of data and hence facilitate better analysis. Drawing multiple series, one in each plot area while sharing some of the chart resources like axes, legend etc. is helpful in scenarios like the one shown in the below chart which demonstrates change in acceleration, velocity and distance against time series. In FlexChart, multiple plot areas can be implemented by adding the plot areas to the PlotAreas collection and while defining the series, specify the plot name in which the same has to be rendered. FlexChart also provides properties to set the height, width, row index and column index of each plot area.
//Add new PlotAreas to FlexChart, Row property decides where to place the PlotArea
flexChart1.PlotAreas.Add(new PlotArea { Name = "plot1", Row = 1 });
flexChart1.PlotAreas.Add(new PlotArea { Name = "plot2", Row = 3 });
flexChart1.PlotAreas.Add(new PlotArea { Name = "plot3", Row = 5 });
//Create new series for Acceleration and set PlotAreaName specifying in which plot to render this series
var acceleration = new Series
{
    Name = "Acceleration",
    DataSource = CreateDataPoints((x) => x, (y) => y, 20),
    AxisY = new Axis {Position = Position.Left, MajorGrid = true, PlotAreaName = "plot1"}
};
this.flexChart1.Series.Add(acceleration);
//Create new series for Velocity and set PlotAreaName specifying in which plot to render this series
var velocity = new Series
{
    Name = "Velocity",
    DataSource = CreateDataPoints((x) => x, (y) => y * y, 20),
    AxisY = new Axis {Position = Position.Left, MajorGrid = true, PlotAreaName = "plot2"}
};
this.flexChart1.Series.Add(velocity);
//Create new series for distance and set PlotAreaName specifying in which plot to render this series
var distance = new Series
{
    Name = "Distance",
    DataSource = CreateDataPoints((x) => x, (y) => 0.5 * y * y * y, 20),
    AxisY = new Axis {Position = Position.Left, MajorGrid = true, PlotAreaName = "plot3"}
};
this.flexChart1.Series.Add(distance);
'Add new PlotAreas to FlexChart, Row property decides where to place the PlotArea
flexChart1.PlotAreas.Add(New PlotArea() With {
.Name = "plot1",
.Row = 1
})
flexChart1.PlotAreas.Add(New PlotArea() With {
.Name = "plot2",
.Row = 3
})
flexChart1.PlotAreas.Add(New PlotArea() With {
.Name = "plot3",
.Row = 5
})
'Create new series for Acceleration and set PlotAreaName specifying in which plot to render this series
Dim acceleration As Series = New Series() With {
.Name = "Acceleration",
.DataSource = CreateDataPoints(Function(x) x, Function(y) y, 20),
.AxisY = New Axis() With {
.Position = Position.Left,
.MajorGrid = True,
.PlotAreaName = "plot1"
}
}
Me.flexChart1.Series.Add(acceleration)
'Create new series for Velocity and set PlotAreaName specifying in which plot to render this series
Dim velocity As Series = New Series() With {
.Name = "Velocity",
.DataSource = CreateDataPoints(Function(x) x, Function(y) y * y, 20),
.AxisY = New Axis() With {
.Position = Position.Left,
.MajorGrid = True,
.PlotAreaName = "plot2"
}
}
Me.flexChart1.Series.Add(velocity)
'Create new series for distance and set PlotAreaName specifying in which plot to render this series
Dim distance As Series = New Series() With {
.Name = "Distance",
.DataSource = CreateDataPoints(Function(x) x, Function(y) 0.5 * y * y * y, 20),
.AxisY = New Axis() With {
.Position = Position.Left,
.MajorGrid = True,
.PlotAreaName = "plot3"
}
}
Me.flexChart1.Series.Add(distance)Note that the above sample code uses a custom method named CreateDataPoints to generate random data. You can set up the data source as per your requirements.
// Method for creating data for FlexChart
public static List<PointD> CreateDataPoints(Func<double, double> funX, Func<double, double> funY, int count)
{
    var data = new List<PointD>();
    for (int i = 0; i < count; i++)
    {
        data.Add(new PointD
        {
            X = funX(i),
            Y = funY(i),
        });
    }
    return data;
}
' Method for creating data for FlexChart
Public Shared Function CreateDataPoints(funX As Func(Of Double, Double), funY As Func(Of Double, Double), count As Integer) As List(Of PointD)
Dim data As List(Of PointD) = New List(Of PointD)()
For i As Integer = 0 To count - 1
data.Add(New PointD() With {
.X = funX(i),
.Y = funY(i)
})
Next
Return data
End Function