
Legend
Legend is a chart element which displays a list of colors, symbols and text corresponding to each data series drawn on that chart. It helps in understanding and analysis of the plotted data in the case of multiple series.
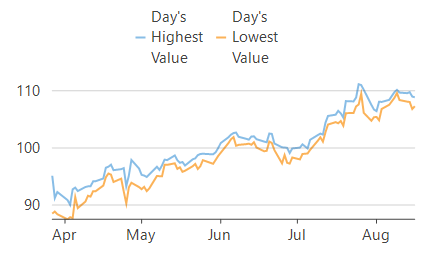
In FlexChart, a legend is automatically displayed if the Name property of the series is set. In other words, the Name property of series is required to generate a legend entry corresponding to the same. Also, FlexChart automatically places the legend according to the space available on the chart area. However, you can also set it to display in top, bottom, left or right with respect to the plot area by setting the Position property. To use the available space in the most optimized manner, FlexChart displays the legend horizontally when placed in top or bottom and vertically when placed in left or right of the plot area. At the same time, FlexChart also allows you to set the Orientation as per requirement.
flexChart1.Series.Clear();
//Setting type of chart to Line
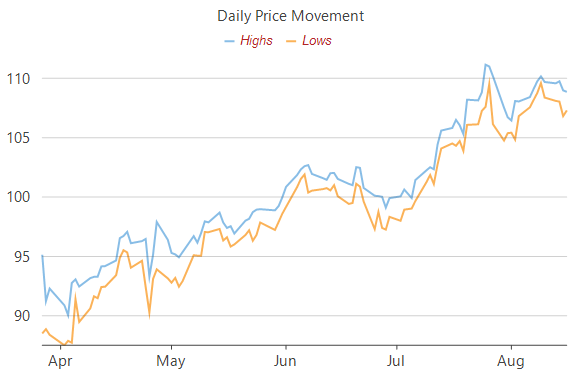
flexChart1.ChartType = ChartType.Line;
//Setting FlexChart's Header
flexChart1.Header.Content = "Daily Price Movement";
//Binding FlexChart's AxisX to 'Name' so country names appear in Horizontal axis
flexChart1.BindingX = "Date";
//Creating and adding multiple series, one for High and one for Low
this.flexChart1.Series.Add(new Series { Binding = "High", Name = "Highs" });
this.flexChart1.Series.Add(new Series { Binding = "Low", Name = "Lows" });
//Passing data in FlexChart
flexChart1.DataSource = GetQuotes(100);
//Setting legends Position and Orientation
flexChart1.Legend.Position = Position.Top;
flexChart1.Legend.Orientation = C1.Chart.Orientation.Horizontal;flexChart1.Series.Clear()
'Setting type of chart to Line
flexChart1.ChartType = ChartType.Line
'Setting FlexChart's Header
flexChart1.Header.Content = "Daily Price Movement"
'Binding FlexChart's AxisX to 'Name' so country names appear in Horizontal axis
flexChart1.BindingX = "Date"
'Creating and adding multiple series, one for High and one for Low
Me.flexChart1.Series.Add(New Series() With {
.Binding = "High",
.Name = "Highs"
})
Me.flexChart1.Series.Add(New Series() With {
.Binding = "Low",
.Name = "Lows"
})
'Passing data in FlexChart
flexChart1.DataSource = GetQuotes(100)
'Setting legends Position and Orientation
flexChart1.Legend.Position = Position.Top
flexChart1.Legend.Orientation = C1.Chart.Orientation.HorizontalToggle Series
With FlexChart, user can even toggle the visibility of a data series by clicking on corresponding legend entry at run-time, if the LegendToggle property of FlexChart class is set to True.
//Allow end user to toggle the visibility of series by clicking the legend
flexChart1.LegendToggle = true;
'Allow end user to toggle the visibility of series by clicking the legend
flexChart1.LegendToggle = TrueManage Long Legend Text
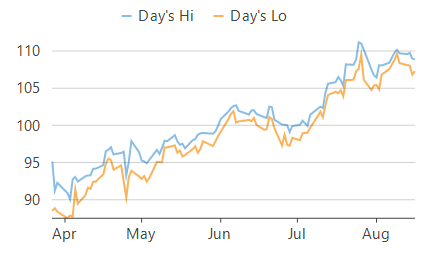
There are times when there is not enough space to display the complete text of legend entries in the chart area. FlexChart provides the TextWrapping property of Legend class that allows you to wrap or trim the text when width of text exceeds the value specified in the ItemMaxWidth property. The TextWrapping property accepts values from TextWrapping enumeration.
TextWrapping = TextWrapping.Wrap | TextWrapping = TextWrapping.Truncate |
|---|---|
|
|
//Wrap the legend if text width exceeds the maximum limit
flexChart1.Legend.ItemMaxWidth = 70;
flexChart1.Legend.TextWrapping = TextWrapping.Wrap;
'Wrap the legend if text width exceeds the maximum limit
flexChart1.Legend.ItemMaxWidth = 70
flexChart1.Legend.TextWrapping = TextWrapping.WrapStyle Legend
FlexChart also allows you to style the legend and legend entries using the Style property of Legend class. This property lets you specify the fill, fill color, stroke width, stroke color etc. of the legend.
//Styling Legends
flexChart1.Legend.Style.Font = new Font("Arial", 10, FontStyle.Italic);
flexChart1.Legend.Style.StrokeWidth = 0.75f;
flexChart1.Legend.Style.StrokeColor = Color.Firebrick;
'Styling Legends
flexChart1.Legend.Style.Font = New Font("Arial", 10, FontStyle.Italic)
flexChart1.Legend.Style.StrokeWidth = 0.75F
flexChart1.Legend.Style.StrokeColor = Color.FirebrickLegend Grouping
Legend grouping refers to categorization of legend entries according to the data presented by them. This feature is usually helpful in identifying the categories of data series in the case of multiple stacked series. For instance, while plotting sales and profit of multiple quarters in the same chart area, legend groups prove helpful in identifying which series are the sales series and which ones are the profit series.
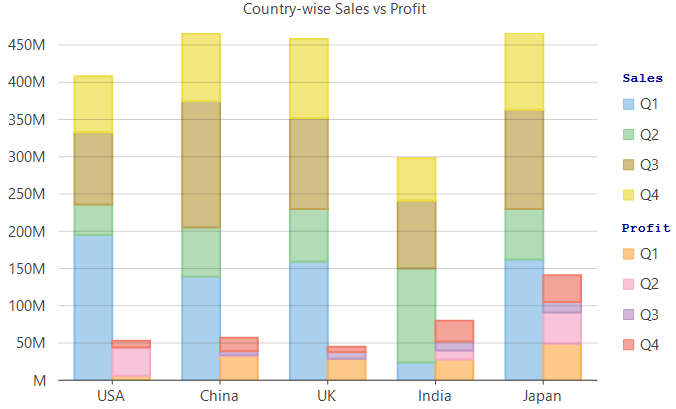
To create legend groups using FlexChart, the control provides the LegendGroup property which accepts a string value and groups the series with same value together. Value of this property not only acts as the group name but the group title as well which gets displayed on the top of the corresponding legend group. The series for which the LegendGroup property is not specified is treated as a part of 0th group and is displayed without any group title. FlexChart also lets you customize the legend group titles by using the GroupHeaderStyle property of Legend class.
//Specify group for each series
flexChart1.Series[0].LegendGroup = "Sales";
flexChart1.Series[1].LegendGroup = "Profit";
flexChart1.Series[2].LegendGroup = "Sales";
flexChart1.Series[3].LegendGroup = "Profit";
flexChart1.Series[4].LegendGroup = "Sales";
flexChart1.Series[5].LegendGroup = "Profit";
flexChart1.Series[6].LegendGroup = "Sales";
flexChart1.Series[7].LegendGroup = "Profit";
// stylise legend group header
flexChart1.Legend.GroupHeaderStyle.Stroke = Brushes.DarkBlue;
flexChart1.Legend.GroupHeaderStyle.Font = new Font(FontFamily.GenericMonospace, 10f, FontStyle.Bold);
'Specify group for each series
flexChart1.Series(0).LegendGroup = "Sales"
flexChart1.Series(1).LegendGroup = "Profit"
flexChart1.Series(2).LegendGroup = "Sales"
flexChart1.Series(3).LegendGroup = "Profit"
flexChart1.Series(4).LegendGroup = "Sales"
flexChart1.Series(5).LegendGroup = "Profit"
flexChart1.Series(6).LegendGroup = "Sales"
flexChart1.Series(7).LegendGroup = "Profit"
' stylise legend group header
flexChart1.Legend.GroupHeaderStyle.Stroke = Brushes.DarkBlue
flexChart1.Legend.GroupHeaderStyle.Font = New Font(FontFamily.GenericMonospace, 10F, FontStyle.Bold)Legend Ranges
The Legend Ranges enables you to categorize continuous data into specific ranges, making it easier to display and understand complex data.
For example, when displaying temperature data across various states, you can group temperatures into ranges and show these groups in the legend. This helps to identify the range of a data point easily, and customizing the range's appearance improves the chart's clarity and look.
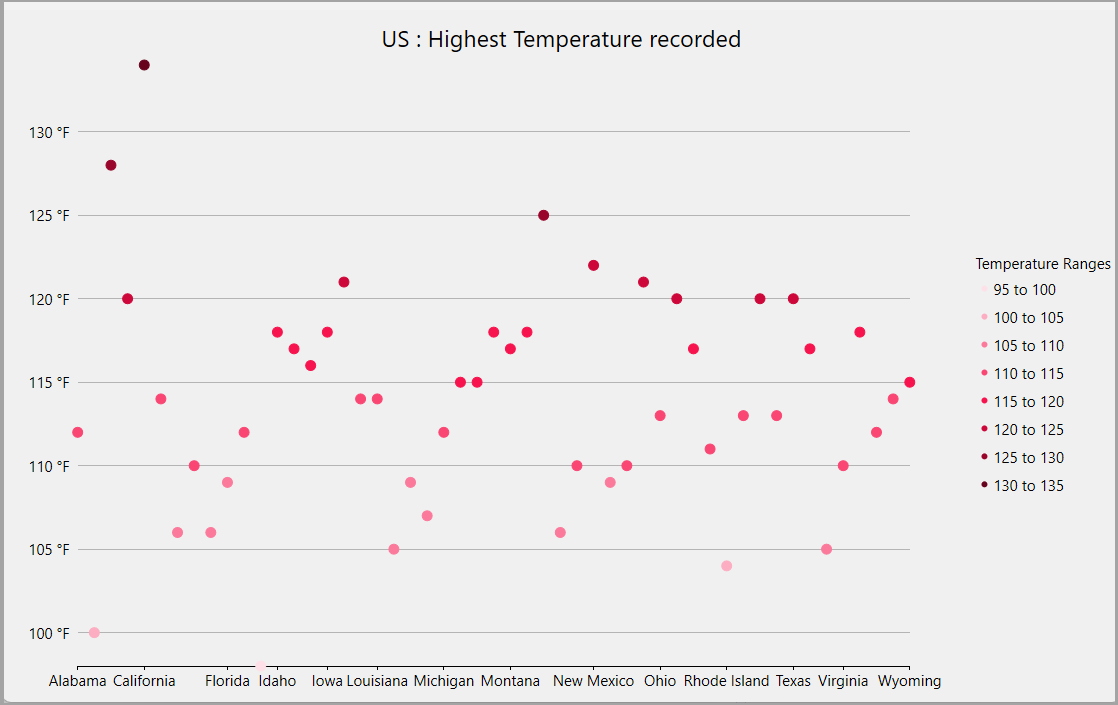
In this example, the chart visualizes the highest temperatures recorded across various US states, with each temperature range being color-coded for clarity. The legend groups the temperatures into ranges like "95 to 100", "100 to 105", and so on. Each range in the legend is assigned a distinct color, which corresponds to the colors used for the data points on the chart.
The SetupChart() method customizes the chart's appearance and implements the Legend Ranges feature by grouping temperature data into 5-degree intervals. The chart header, tooltip, axis format, and legend are configured using properties like flexChart1.Header.Content, flexChart1.ToolTip.Content, and flexChart1.AxisY.Format. The data is sourced from DataService.GetUSStatesTemperature(), with ChartType.Scatter used for visualization. A series is created using the SeriesWithPointLegendItems class, which defines custom legend items. The Ser_SymbolRendering method applies gradient colors to data points based on their values, using a formula to determine the appropriate range and selecting the corresponding color from the GradientRedColors array.
Type your example code here. It will be automatically colorized when you switch to Preview or build the help system.The SeriesWithPointLegendItems class implements the ISeries interface to manage the legend’s behavior by dynamically generating legend item names and defining their styles. The GetLegendItemLength method specifies the number of legend items, while GetLegendItemName dynamically creates the names for each range by calculating the lower and upper bounds. The GetLegendItemStyle method customizes the legend item’s appearance by assigning colors from the gradient collection, ensuring that the legend accurately reflects the grouped data ranges.
Type your example code here. It will be automatically colorized when you switch to Preview or build the help system.