
Axes
Most of the chart types are plotted between the two axes, horizontal axis and vertical axis commonly known as X and Y-axis respectively. Often X-axis is used to plot categories and Y-axis to plot values, however in some cases such as bar chart, Y-axis is used as a category axis while X-axis is used as a value axis. Similarly, depending on the data, there are cases when both of the axes are used as value axis. Note that charts such as pie chart, sunburst or treemap are some of the exceptions to this and do not possess any axis.
In FlexChart, the two axes are represented by the AxisX and AxisY property which return an object of the Axis class. Apart from binding the chart with a data source, FlexChart also lets you bind individual axes to separate data source and fields allowing you to display axis labels different from what is available in the chart data source.
//Passing data to FlexChart's AxisY
this.flexChart1.AxisY.DataSource = GetAxisBindinglabels();
//Setting which fields to bind to AxisY
this.flexChart1.AxisY.Binding = "Value,Text";
'Passing data to FlexChart's AxisY
Me.flexChart1.AxisY.DataSource = GetAxisBindinglabels()
'Setting which fields to bind to AxisY
Me.flexChart1.AxisY.Binding = "Value,Text"Note that the above code snippet uses a custom method GetAxisBindinglabels to supply data for axis binding. For information about axis binding, see Axis Binding.
Position an Axis
By default, FlexChart renders the X-axis at bottom and Y-axis on left side of the chart. However, you can change the position of these axes to top, right, center etc. by setting the Position property which accepts the values from Position enumeration. Setting this property to None hides the axis itself.
//Displaying the Y axis on right hand side
      this.flexChart1.AxisY.Position = Position.Right;
' Displaying the Y axis on right hand side
Me.flexChart1.AxisY.Position = Position.Right Show or Hide an Axis Line
By default, FlexChart displays axis line for X-axis but doesn't display the same for Y-axis. To toggle the visibility of axis lines, you need to set the AxisLine property of the target axis.
//Showing axis line for Y-axis, by default it is hidden
      this.flexChart1.AxisY.AxisLine = true;
' Showing axis line for Y-axis, by default it is hidden
me.flexChart1.AxisY.AxisLine = true Set Axis Bounds
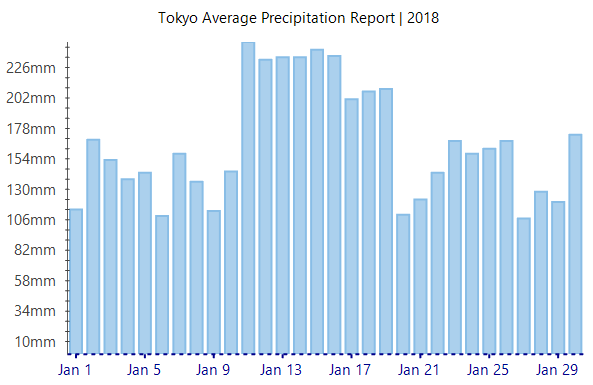
FlexChart also allows you to set the minimum and maximum values that can be plotted on an axis by using the Min and Max properties respectively. This helps you analyze a sub-set of data by plotting target data only instead of cluttering the chart plot area with whole data set.
//Setting axis bounds
   this.flexChart1.AxisY.Max = 150;
this.flexChart1.AxisY.Min = 90;
' Setting axis bounds
me.flexChart1.AxisY.Max = 150
me.flexChart1.AxisY.Min = 90 Display Reverse Axis
In some cases, flipping an axis to start displaying the values from maximum to minimum helps in better presentation of data such as height of various waterfalls or depth of an ocean at different levels. FlexChart lets you display the reversed axis by setting the Reversed property to True.
//Flip the Y-axis to display minimum value on top and maximum towards origin
     this.flexChart1.AxisY.Reversed = true;
' Flip the Y-axis to display minimum value on top and maximum towards origin
me.flexChart1.AxisY.Reversed = true Display Multiple Axes
Along with default X and Y-axis, FlexChart allows you to display multiple axes in the same chart. This allows you to handle multiple series with significantly different range of values. To add a secondary axis to the chart, you need to add a new axis for the series with different data values.
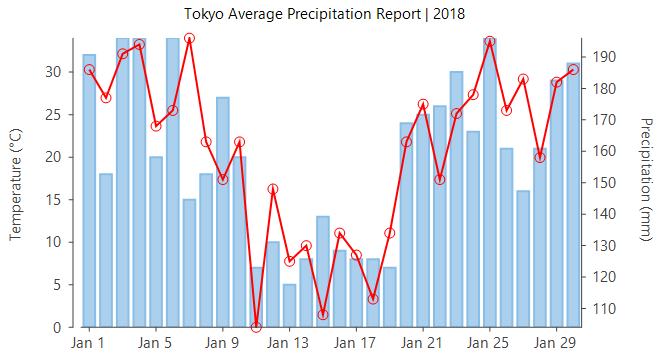
//Creating and adding first Series to chart and binding it (AxisY) to 'HighTemp' field of Data
var series1 = new Series()
{
    //Name property specifies the string to be displayed corresponding to this Series in Legend
    Name = "Temperature(°C)",
    Binding = "HighTemp",
    //With more than one series setting ChartType (default:column) is mandatory
    ChartType = ChartType.Column,
    //Adding axis to the series
    AxisY = new Axis()
    {
        //Set where to show the AxisLine relative to PlotArea
        Position = Position.Left,
        //Title property specifies the string to be displayed along AxisLine
        Title = "Temperature (°C)",
        //Whether or not to show the AxisLine
        AxisLine = true,
    }
};
this.flexChart1.Series.Add(series1);
//Creating and adding second Series to chart and binding it (AxisY) to 'Precipitation' field of Data
var series2 = new Series()
{
    //Name property specifies the string to be displayed corresponding to this Series in Legend
    Name = "Precipitation(mm)",
    Binding = "Precipitation",
    //With more than one series setting ChartType (default:column) is mandatory
    ChartType = ChartType.LineSymbols,
    //Adding axis to the series
    AxisY = new Axis()
    {
        //Set where to show the AxisLine relative to PlotArea
        Position = Position.Right,
        //Title property specifies the string to be displayed along AxisLine
        Title = "Precipitation (mm)",
        //Whether or not to show the AxisLine
        AxisLine = true,
    },
};
this.flexChart1.Series.Add(series2);
'Creating and adding first Series to chart and binding it (AxisY) to 'HighTemp' field of Data
'Name property specifies the string to be displayed corresponding to this Series in Legend
'With more than one series setting ChartType (default:column) is mandatory
'Adding axis to the series
'Set where to show the AxisLine relative to PlotArea
'Title property specifies the string to be displayed along AxisLine
'Whether or not to show the AxisLine
Dim series1 As Series = New Series() With {
.Name = "Temperature(°C)",
.Binding = "HighTemp",
.ChartType = ChartType.Column,
.AxisY = New Axis() With {
.Position = Position.Left,
.Title = "Temperature (°C)",
.AxisLine = True
}
}
Me.flexChart1.Series.Add(series1)
'Creating and adding second Series to chart and binding it (AxisY) to 'Precipitation' field of Data
'Name property specifies the string to be displayed corresponding to this Series in Legend
'With more than one series setting ChartType (default:column) is mandatory
'Adding axis to the series
'Set where to show the AxisLine relative to PlotArea
'Title property specifies the string to be displayed along AxisLine
'Whether or not to show the AxisLine
Dim series2 As Series = New Series() With {
.Name = "Precipitation(mm)",
.Binding = "Precipitation",
.ChartType = ChartType.LineSymbols,
.AxisY = New Axis() With {
.Position = Position.Right,
.Title = "Precipitation (mm)",
.AxisLine = True
}
}
Me.flexChart1.Series.Add(series2)Style an Axis
FlexChart allows you to customize the axis lines and make your charts look attractive and in sync with rest of the application UI. The Axis class of FlexChart provides Style property that can be accessed to change the stroke color, stroke width, line pattern etc. of an axis.
//Setting color to be used for stroke
this.flexChart1.AxisX.Style.StrokeColor = Color.DarkBlue;
//Setting width to be used for stroke width
this.flexChart1.AxisX.Style.StrokeWidth = 1;
//Setting pattern to be used line pattern
this.flexChart1.AxisX.Style.LinePattern = LinePatternEnum.DashDot;
'Setting color to be used for stroke
Me.flexChart1.AxisX.Style.StrokeColor = Color.DarkBlue
'Setting width to be used for stroke width
Me.flexChart1.AxisX.Style.StrokeWidth = 1
'Setting pattern to be used line pattern
Me.flexChart1.AxisX.Style.LinePattern = LinePatternEnum.DashDotApart from the features mentioned above, FlexChart also provides you options to customize axis elements such as titles, tick marks, units etc. and axis labels. You can also group the axis for better analysis and presentation needs. Following sections discuss more about these features related to axis and axis elements.
Discusses about axis elements and their customization.
Discusses axis labels, their customization and options to handle their overlapping.
Discusses various types of axis grouping: categorical, numerical and DateTime axis grouping