1731993306942
Demo
Demos
Docs
API
More Samples
Download
Demos
Demos
Reference Samples
Angular
Reference Samples
JavaScript
Angular
React
React Redux
Vue 3
Vue
Wijmo
Globalization
Formatting
Parsing
Customization
Template Literals
Template Strings
Pluralization
CollectionView
Overview
Loading Data
Loading Data from Client
Loading Data from Server
Loading JSON Dates
Spinners
Creating Views
Currency
Sorting
Overview
International Sort
Stable Sort
Filtering
Overview
Multi Filter
Chaining
Grouping
Overview
Custom Groups
Paging
Editing Views
Editing
Adding/Removing Items
Tracking Changes
Validation
Navigating Views
CollectionViewNavigator
Calculated Fields
REST CollectionView
OData
Firestore
JSONPlaceholder
ReqRes
RestAPI
Overview
Server Side Grouping
PrintDocument
Clipboard
Tooltips
Color
Glyphs
HttpRequest
Animate
ShowPopup
Grid
Overview
Data-binding
Basics (CollectionView)
OData
Virtual OData
Infinite Scrolling
Unbound Grid
Cloud Data Sources
Firestore
Overview
Limit Data
Google Sheets
Snapshot
Immutable Data
Redux
Editable Redux Grid
Columns
Column Width
DataMaps
Simple DataMaps
Dynamic DataMaps
DataMap Editors
Column Picker
Reordering
Resizing
Sorting
Selecting
Freezing
Pinning
Column Groups
Overview
Object Model
Header Tooltips
Sticky Headers
Collections
Rows
Adding and Removing
Row Height
Freezing
Collections
Row Detail
Overview
Customization
Reordering
Custom Cells
Cell Templates
Overview
Common Tasks
CellMaker
Buttons
Hyperlinks
Images
Ratings
Sparklines
Conditional Styling
Cell Notes
Dynamic Updates
Sparklines
Custom Editors
Paging / Scrolling
Client-side Paging
Server-side Paging
Scroll Virtualization
No Scrollbars
Fast Scroller
Scrolling and ViewRange
Sorting
Overview
On-demand Sorting
Multi-Column Sorting
Editing
Overview
Quick Editing
Read-only
Validation
Event-Based Validation
CollectionView-Based Validation
Highlight Edits
Editing Events
Always Editing
Inline Editing
Popup Editors
Custom Editors
IME
Selection
Overview
Multiple Selection
Checkbox Selection
Searching
Marquee
Focus
Grouping
Groups
GroupPanel
GroupPanel with Context Menu
Aggregation
Aggregate group
Above the data
Below the data
Custom aggregation
Merging
Cell Merging
Header Merging
Custom Merging
Restricted Merging
Filtering / Searching
Filter
Excel-like Filter
Overview
Custom Filter Type
Custom Filter Icons
Custom Filter Operators
Optimizations
Search
Server-side
Hierarchical Data
On-demand Filtering
Frozen Cells API
Context Menus
TreeGrid
Child Items
Editable TreeGrid
Unbound TreeGrid
Lazy Loading
Binding to XML
Master-Detail
Separate Grid
Nested Grid (RowDetail)
MultiRow
Layout Definition
Collapsible Column Headers
Custom Column Headers
Styling Records, Groups, and Cells
Grouping
Aggregates
Filtering
Row And Column Freezing
Paging
Adding and Deleting Records
Cell Templates
Transfer Slip
Orders Slip
Order Detail
Purchase Slip
Order Management
Sales Slip
FlexSheet
Unbound
Bound
Sorting
Filtering
Formatting Cells
Multiple Headers
Cell Merging
Drag and Drop
Frozen Cells
Formulas
Custom Function
Table
Excel Import Export
TransposedGrid
Product Sheet
Row Grouping
TransposedMultiRow
Layout Definition
Import / Export / Print
Excel
Async
Progress Indicator
PDF
Export to file
Export to PdfDocument
Custom fonts
Expense report
Expense analysis report
Custom cell content
Customize cell rendering
Drawing cells manually
Highlight invalid cells
Web Workers
Progress Indicator
Security
Accessibility
Print
Events
Mouse
Keyboard
Selection
Editing
Resizing
Reordering
Drag and Drop
Accessibility Extender
Clipboard
Sizing
Overview
Sizing with Mouse
Auto-size Rows
Auto-size Rows Async
Auto-size Columns
Deferred Resizing
Styling
Rows
Overview
Row Heights
Preserve Row Heights
Columns
Cells
Overflow
Spill
Vertical Alignment
Hover
Responsive
Animation
Persisting State
Right to Left
Chart
Overview
Sales Dashboard
Bar Charts
Basic Column Chart
Stacked Bar
Column With Negative Values
Column With Data Label
Range Bar
Bar With Line
Column With Axis Range
Column With Error Bars
Column With Drill-down
Custom Column Series
Line & Area Charts
Basic Line Chart
Basic Area Chart
Stacked Line with LineMarker
Stacked 100% Area
Spline with Symbols
Area with Annotations
Line with Gaps
Range Selection
Aggregate Date Series
Dynamic Line Chart
Logarithmic Axis
Custom Line Segments
Custom Function
Range Area
Step Chart
Rotated Spline Chart
Scatter & Bubble Charts
XY Scatter Plot
Scatter with Conditional Formatting
Scatter with Trendline
Bubble chart
Bubble with Zones
Scatter Quadrant
Select Box
Bubble with Animation
Pie & Sunburst Charts
Basic Pie Chart
Donut Chart with Labels
Pie Animation
Selectable Slices
Pie with Gradient Fill
Sunburst
Periodic Sunburst
Multiple Pie Charts
Treemap
Grouped TreeMap
TreeMap Depth
Horizontal & Vertical Treemap
Polar & Radar Charts
Basic Radar Chart
Radar Filled Chart
Basic Polar Chart
Financial Charts
Candlestick Chart
HighLowOpenClose Chart
Heikin-Ashi Chart
Line Break Chart
Renko
Kagi
Volume Charts
Financial Indicators
Financial Overlays
Event Annotations
Fibonacci Tools
Special Charts
Box & Whisker
ErrorBars
Funnel Chart
Funnel Rectangle
Gantt
Repeating Tasks
Pareto
Waterfall
Break-Even
Chart Features
Alarm Zones
Animation
Annotations
Axis Groups
Axis Origin & Position
Conditional Formatting
Data Labels
Editable Annotations
Filter and Wheel Zoom
Custom Axis Labels
Custom Series
Custom Tooltips
Export
Gradients
Gridlines & Tickmarks
Hit-Testing
HTML Text
Legends and Titles
Legend Toggle
Line Markers
Logarithmic Axis
Moving Averages
Multiple Axes
Multiple Plot Areas
Palettes
Selection
Series Picker
Scrolling & Range Selectors
Sorting
Stacked Plot Areas
Styling Series
Trendlines
Zooming and Panning
Performance
WebGL
Scatter
Map
Scatter Map
US Choropleth
Bubble Map
Gauge
Overview
Basic Properties
BulletGraph
LinearGauge
RadialGauge
Ranges
Stacked Ranges
Styling
Overview
Hover
Focus
Ranges
Gauge Elements
Overview
Face
Pointer
Needle Pointer
Ranges
Thumb
Tickmarks
Tickmark Text
Text Value
Input
AutoComplete
Overview
Async Loading
Searching
Overview
Search Path
Search Params
Custom Search
Auto-Add Items
Filtering
Calendar
Overview
Ranges (min/max)
Styling
Slack Status Calendar
Validation
ColorPicker
Overview
ComboBox
Overview
Strings
Numbers and Dates
Objects
Overview
Master/Detail
Sorting and Filtering
Chaining Combos
Grouping
Overview
Custom Grouping
Category Grouping
Multi-column
HTML Content
Auto-Add Items
Infinite Scrolling
DropDown
Overview
InputColor
Overview
Contrast Checker
InputDate
Overview
Formatting
Ranges
Customization
Validation
InputDateTime
Overview
InputDateRange
Overview
InputMask
Overview
Raw Value
Prompt Character
Validation
InputNumber
Overview
Formatting
Step
Ranges
InputTime
Overview
ListBox
Overview
Customization
Checkboxes
Infinite Scroll
Menu
Overview
Commands
Value Pickers
Split Buttons
Context Menus
Hierarchical Menus
Dynamic Items
MultiAutoComplete
Overview
MultiSelect
Overview
No Checked Item
Customization
MultiSelectListBox
Overview
Popup
Dialogs
Alerts and Prompts
Transitions
Popup Editors
Popup with FlexGrid
Draggable Dialogs
Resizable Dialogs
Popups with Owner Elements
Labeled Input
Nav
Accordion
Overview
TabPanel
Overview
Markup
Hosting GC Controls
Tabs in Code
Ribbon
Styling
Disabled and Invisible Tabs
Detached Panels
Accessibility
Right to Left
TreeView
Navigation Tree
Behavior
Context Menus
Searching
Styling
Overview
Node Borders
Accordion Trees
Clean Accordion
Nodes
Overview
Images
Checkboxes
Custom Content
Showing and Selecting Nodes
Editing
Disabling
Adding
Removing
Refreshing
Drag and Drop
Drag and Drop Between Trees
Data Binding
Initial State
Heterogeneous Data
Lazy Loading
Lazy Loading OData
Lazy Re-loading
Performance
Right to Left
Undo
UndoStack
Cloud
Firestore
Overview
Limit Data
Snapshot
Overview
Google Sheets
Overview
OLAP
PivotEngine
Overview
Performance
Defining Views
Server Side data
OLAP cubes (MS SSAS)
C1 Data Engine
PivotPanel
Overview
Drag & Drop fields
Fields
Types
Value Fields
Row/Column Fields
Filter Fields
Customize
Field Settings Dialog
Filter
Sort
Summary functions
ShowAs functions
Formats
Calculated Field Values
Calculated Field Aggregates
Hierarchical Fields
Custom layouts
Control Template
Stacked
Side by Side
2 columns
Fields only
Areas only
PivotGrid
Overview
Sort
Expand/Collapse Rows and Columns
Detail Dialog
Outline Mode
Totals
Subtotals
Customize Field cells
HTML Content
Sparklines
Export
Excel, PDF, CSV
PivotChart
Overview
Chart Types
Title
Legend
Export
Slicer
PDF
Overview
Page structure
Drawing graphics
Drawing text
Fonts
Custom fonts
Rich text
Drawing images
Custom headers and footers
Drawing tables
Expense report
Drawing FlexPie (raster)
Drawing FlexPie (SVG)
Security
Accessibility
Viewer
PdfViewer
Overview
ReportViewer
Overview
Viewing FlexReport Reports
Viewing SSRS Reports
Excel
Expense Report
Workbook Viewer
Barcode
Codabar
Code39
Code49
Code93
Code128
DataMatrix
DataMatrix ECC 200
DataMatrix ECC 000 - ECC 140
EAN
EAN-8
EAN-13
GS1-128
GS1DataBar
GS1 DataBar Expanded
GS1 DataBar Expanded Stacked
GS1 DataBar Limited
GS1 DataBar Omnidirectional
GS1 DataBar Stacked
GS1 DataBar Stacked Omnidirectional
GS1 DataBar Truncated
Interleaved 2 of 5
ITF-14
Japanese Postal
PDF
PDF417
MicroPDF417
QR code
UPC
UPC-A
UPC-E0
UPC-E1
Angular
Crypto Currency Tracking
Demonstrates how to use Wijmo interops to implement crypto currency tracking application in different frameworks.
react-redux
angular
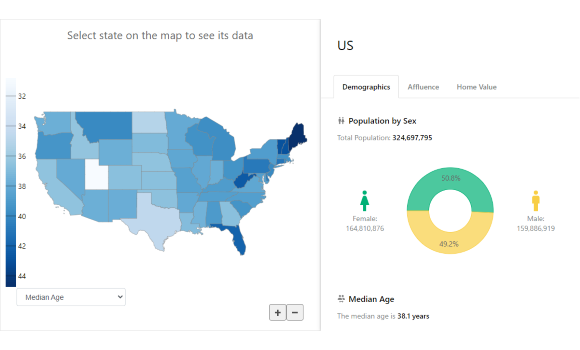
Geo Dashboard
An interactive geographic dashboard for analyzing demographic data.
angular
react
vue
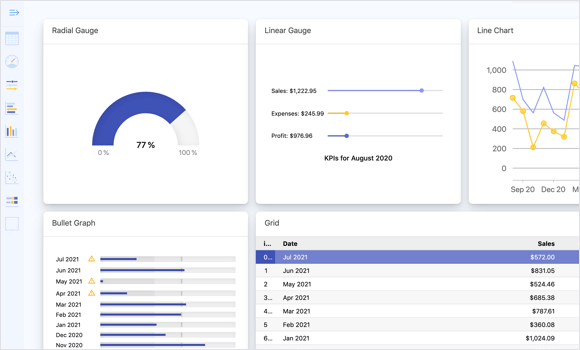
Dynamic Dashboard
Shows how you can use Wijmo controls in dynamic, user-customizable dashboards.
angular
purejs
react
vue
vue3
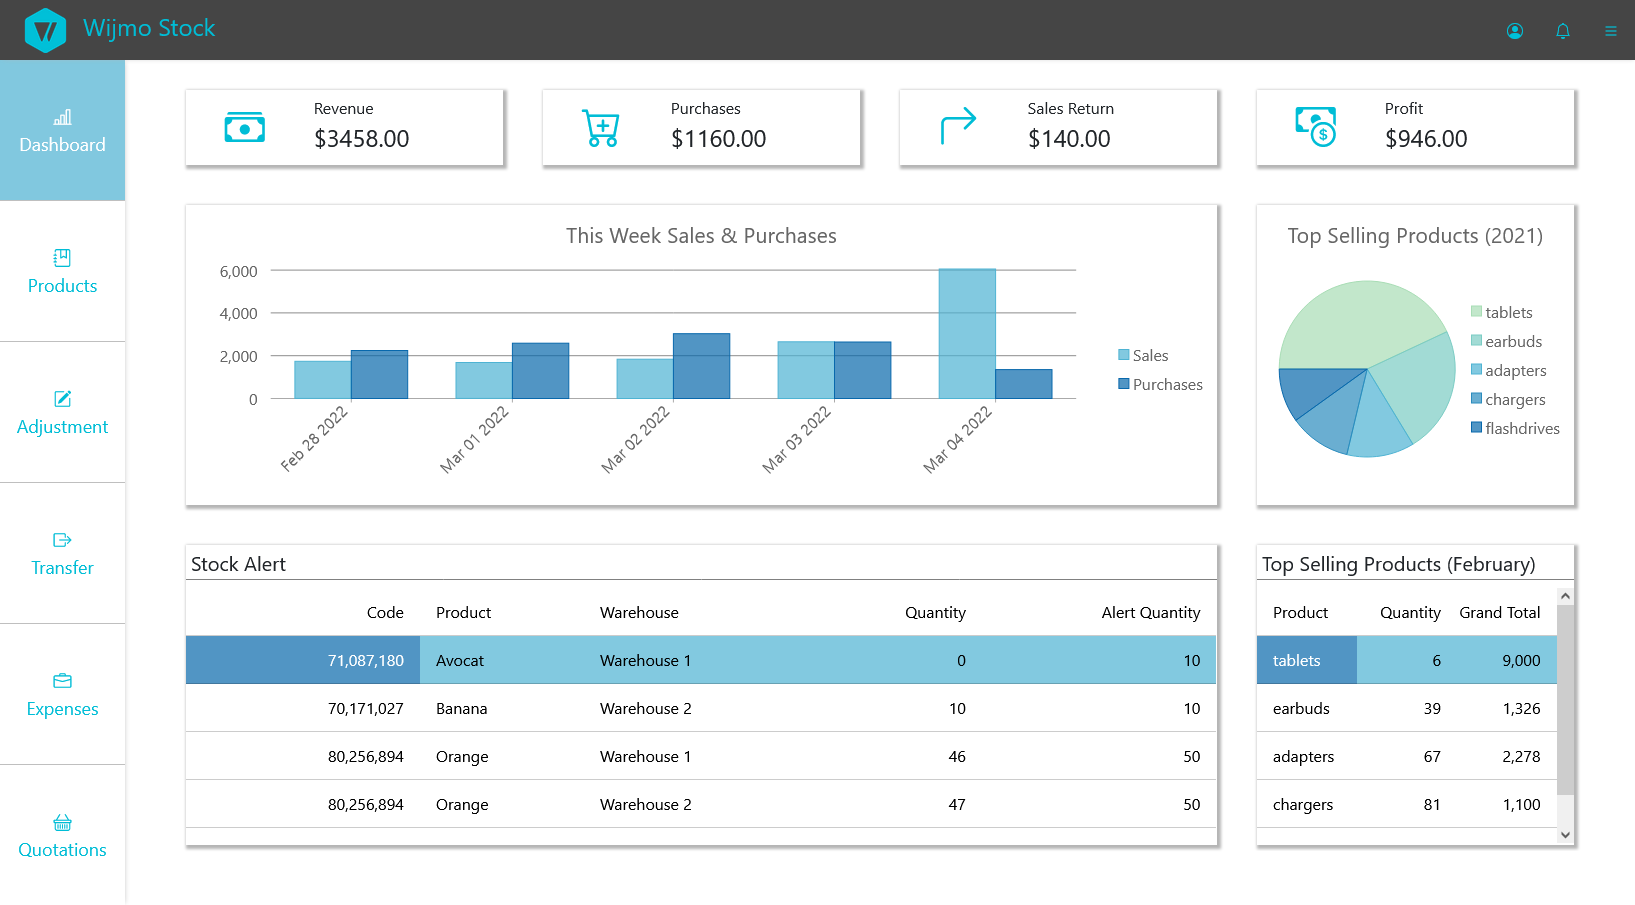
Product Stock Dashboard
Shows how to use Wijmo to create a dashboard application for managing warehouse stock
angular
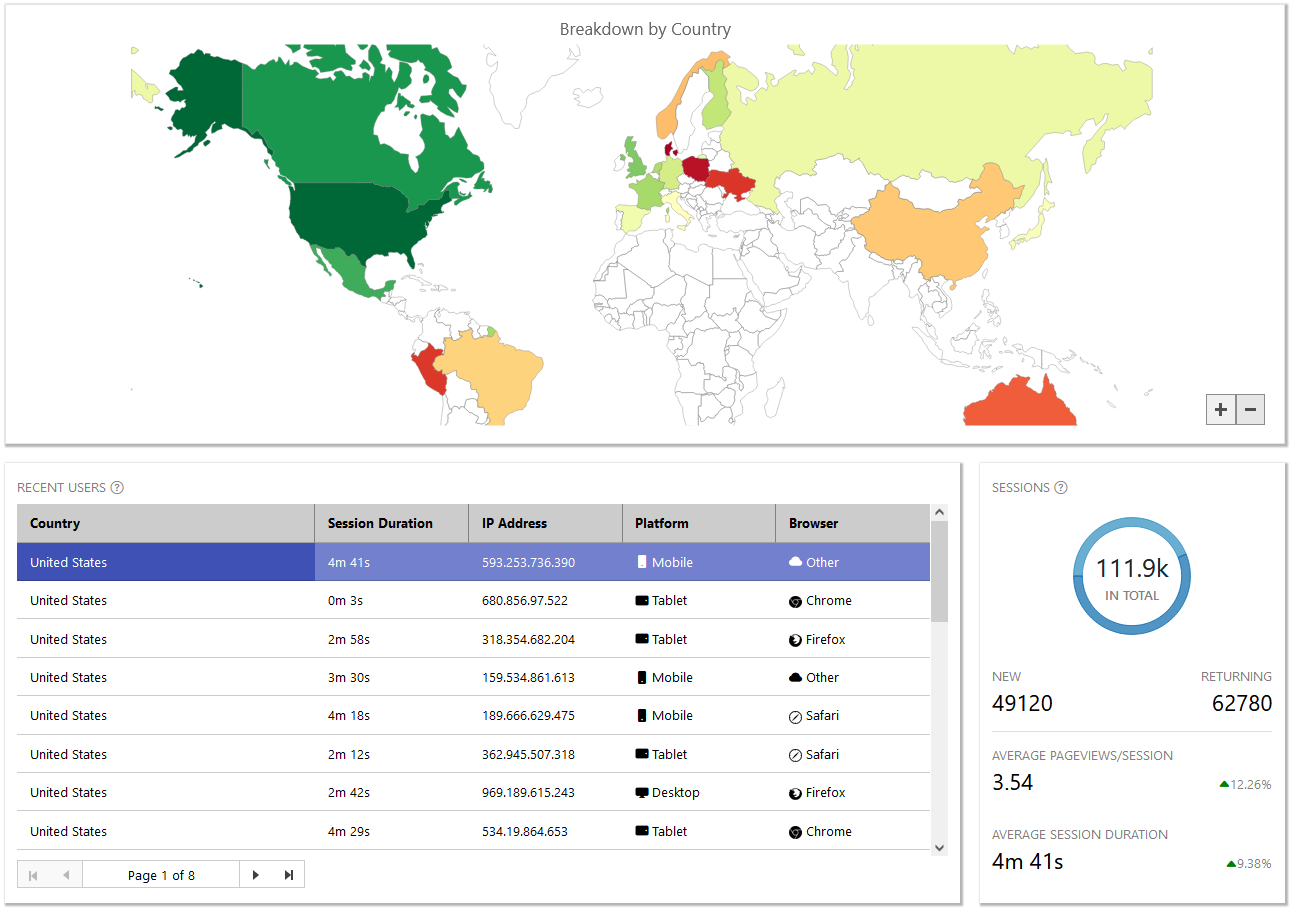
Website Sessions Dashboard
Demonstrates how to use Wijmo controls to create an interactive map dashboard.
angular