
- SpreadJS Overview
- Getting Started
- JavaScript Frameworks
- Best Practices
-
Features
- Workbook
- Worksheet
- Rows and Columns
- Headers
- Cells
- Data Binding
- Data Manager
- TableSheet
- GanttSheet
- ReportSheet
- Data Charts
- JSON Schema with SpreadJS
- SpreadJS File Format
- Data Validation
- Conditional Formatting
- Sort
- Group
- Formulas
- What-If Analysis
- Serialization
- Keyboard Actions
- Shapes
- Floating Objects
- Barcodes
- Charts
- Sparklines
- Tables
- Pivot Table
- Slicer
- Theme
- User Management
- Culture
- AI Assistant
- SpreadJS Designer
- SpreadJS Designer VSCode Plugin
- Tutorials
- SpreadJS Designer Component
- SpreadJS Collaboration Server
- Touch Support
- Formula Reference
- Import and Export Reference
- Events
- API Documentation
- Release Notes
Treemap Charts
A treemap chart visualizes hierarchical data using nested rectangles.
Each rectangle represents a node in the hierarchy.
The size of each rectangle is determined by a numeric value.
The hierarchy is defined by multiple fields in the
detailsencoding.
Treemaps are useful for comparing proportions across hierarchical categories in a compact layout.
Data Structure Requirements
A treemap chart requires:
A numeric field in
valuesto determine rectangle size.One or more categorical fields in
detailsto define hierarchy levels.
When multiple fields are specified in details, they form a hierarchy in the given order:
details: [
  { field: 'Category' },
  { field: 'Subcategory' },
  { field: 'Product' }
]Category→ top-level groupsSubcategory→ nested within CategoryProduct→ leaf nodes
By default, only leaf nodes are rendered as visible rectangles.
Example Data
const dataManager = spread.dataManager();
function createTreemapTable(dataManager) {
const records = [
['Beverages', 'Juice', 'Apple Juice', 420],
['Beverages', 'Juice', 'Orange Juice', 680],
['Beverages', 'Dairy', 'Milk', 950],
['Snacks', 'Chocolate', 'Dark Chocolate', 530],
['Snacks', 'Chocolate', 'Milk Chocolate', 610],
['Snacks', 'Meat', 'Beef Jerky', 720],
['Snacks', 'Chips', 'Potato Chips', 480],
['Snacks', 'Chips', 'Corn Chips', 390],
];
const columns = ['Category', 'Subcategory', 'Product', 'Sales'];
return dataManager.addTable('TreemapData', {
data: records.map((x) => {
const record = {};
columns.forEach((c, i) => record[c] = x[i]);
return record;
})
});
}
const TreemapData = createTreemapTable(dataManager);
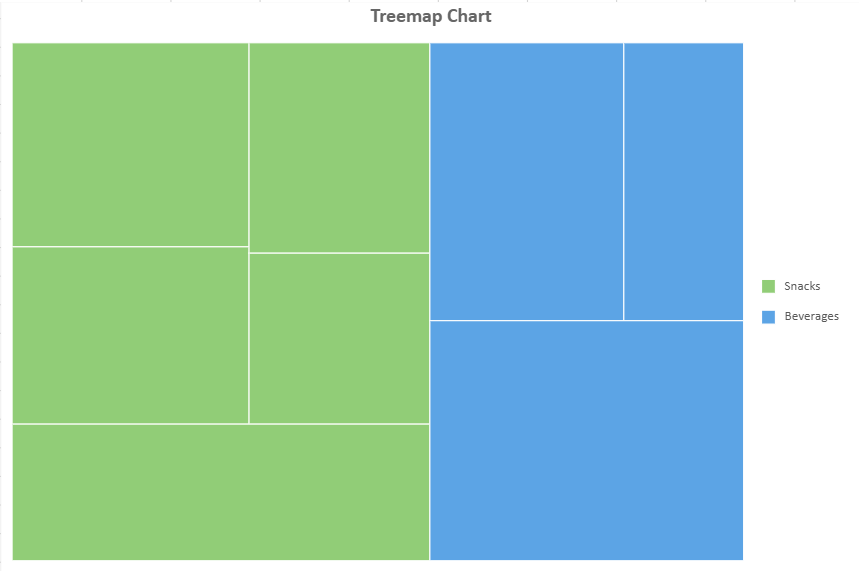
await TreemapData.fetch();Create a Treemap Chart
const sheet = spread.getActiveSheet();
sheet.name("Treemap Chart");

const dataChart = sheet.dataCharts.add('data-chart', 10, 10, 600, 400);

dataChart.setChartConfig({
  tableName: 'TreemapData',
  plots: [
    {
      type: GC.Spread.Sheets.DataCharts.DataChartType.treemap,
      encodings: {
        values: [
          {
            field: 'Sales',
            aggregate: GC.Spread.Sheets.DataCharts.Aggregate.sum
          }
        ],
        details: [
          { field: 'Category' },
          { field: 'Subcategory' },
          { field: 'Product' }
        ]
      }
    }
  ],
  config: {
    header: {
      title: "Treemap Chart",
      textStyle: {
        fontSize: 18,
        fontWeight: 'Bold'
      }
    }
  }
});
Customize Leaf Node Labels
You can display text inside leaf nodes using the text configuration in the plot.
config: {
  text: [{
    template: '{detailFields.value}',
  }]
}
Complete Example
dataChart.setChartConfig({
  tableName: 'TreemapData',
  plots: [
    {
      type: GC.Spread.Sheets.DataCharts.DataChartType.treemap,
      encodings: {
        values: [
          {
            field: 'Sales',
            aggregate: GC.Spread.Sheets.DataCharts.Aggregate.sum
          }
        ],
        details: [
          { field: 'Category' },
          { field: 'Subcategory' },
          { field: 'Product' }
        ]
      },
      config: {
        text: [
          {
            template: '{detailFields.value}'
          }
        ]
      }
    }
  ],
  config: {
    header: {
      title: "Treemap Chart",
      textStyle: {
        fontSize: 18,
        fontWeight: 'Bold'
      }
    }
  }
});
This configuration applies to leaf nodes only.
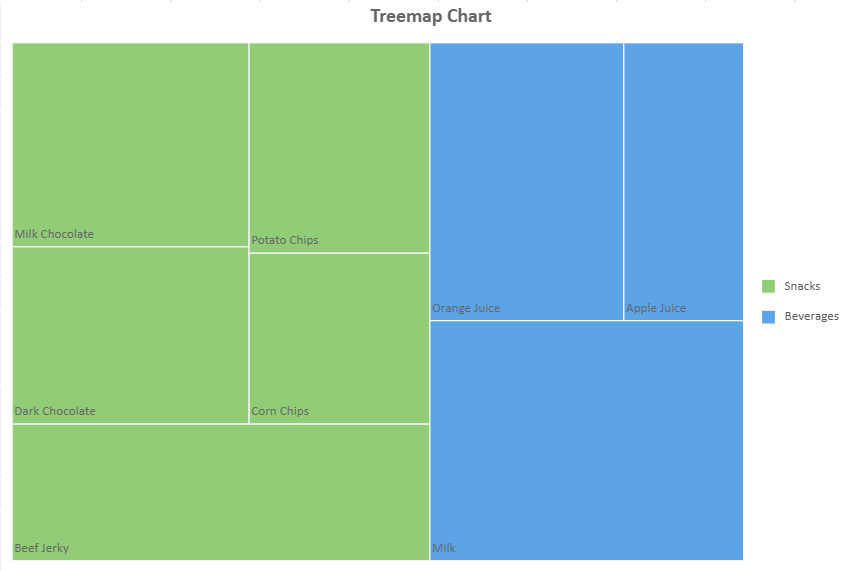
The template property uses the same template mechanism as other Data Chart labels.
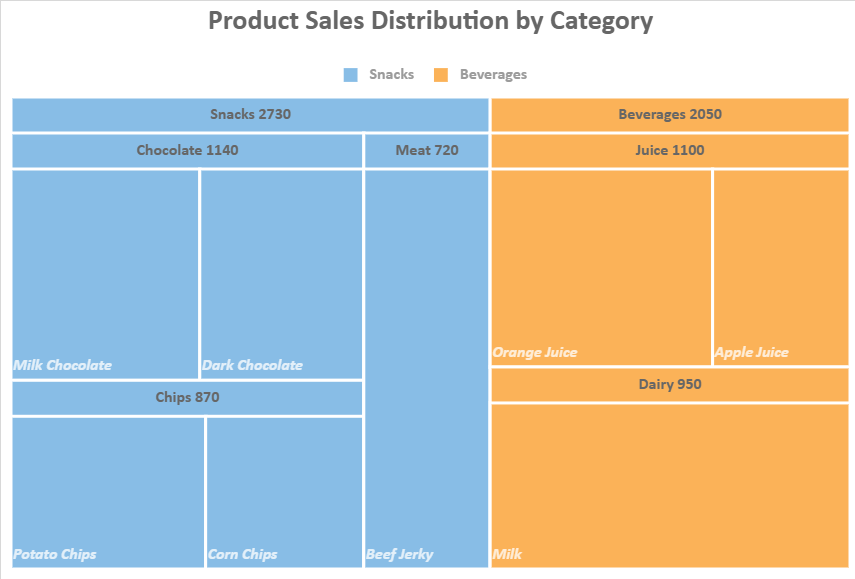
Display Non-Leaf Nodes with Headers
When multiple levels are defined in details, you can enable treemap headers to display non-leaf nodes.
Unlike text, which applies to leaf nodes, treemap headers are rendered for non-leaf nodes.
Enable Treemap Header
Configure the header option inside treemap in the plot configuration:
config: {
  treemap: {
    header: {
      template: '{detailFields.value}',
    textStyle: {
      fontSize: 14,
      fontWeight: 'Bold'
    }
    }
  }
}
Complete Example
dataChart.setChartConfig({
  tableName: 'TreemapData',
  plots: [
    {
      type: GC.Spread.Sheets.DataCharts.DataChartType.treemap,
      encodings: {
        values: [
          {
            field: 'Sales',
            aggregate: GC.Spread.Sheets.DataCharts.Aggregate.sum
          }
        ],
        details: [
          { field: 'Category' },
          { field: 'Subcategory' },
          { field: 'Product' }
        ]
      },
      config: {
        text: [
          {
            template: '{detailFields.value}'
          }
        ],
        treemap: {
          header: {
            template: '{detailFields.value}',
            textStyle: {
              fontSize: 14,
              fontWeight: 'Bold'
            }
          }
        }
      }
    }
  ],
  config: {
    header: {
      title: "Treemap Chart",
      textStyle: {
        fontSize: 18,
        fontWeight: 'Bold'
      }
    }
  }
});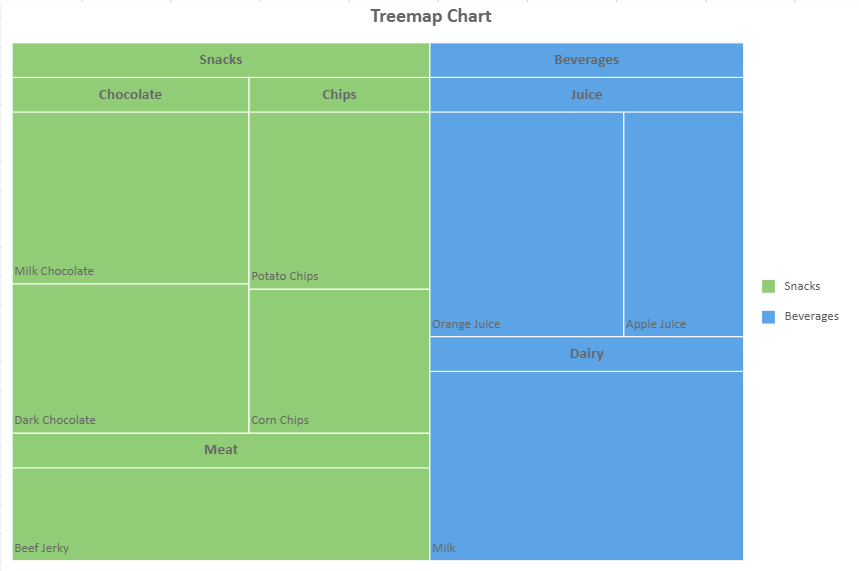
If template is not specified or is an empty string, the header is not displayed.
Header Behavior
The header occupies space within the node.
The subtree is laid out in the remaining area.
The header size automatically adjusts to fit its content.
If the header size exceeds its parent rectangle, the header is not displayed.
Limitations
Hover animation is not supported.
The
alignmentandoverflowproperties intextStyledo not take effect for treemap headers.Newline characters are not supported in treemap header text.