


- SpreadJS Overview
- Getting Started
- JavaScript Frameworks
- Best Practices
-
Features
- Workbook
- Worksheet
- Rows and Columns
- Headers
- Cells
- Data Binding
- Data Manager
- TableSheet
- GanttSheet
- ReportSheet
- Data Charts
- JSON Schema with SpreadJS
- SpreadJS File Format
- Data Validation
- Conditional Formatting
- Sort
- Group
- Formulas
- What-If Analysis
- Serialization
- Keyboard Actions
- Shapes
- Floating Objects
- Barcodes
- Charts
-
Sparklines
- Column, Line, and Winloss Sparklines with Methods
- Markers and Points
- Horizontal and Vertical Axes
- Column, Line, and Winloss Sparklines with Formulas
- Area Sparkline
- Pie Sparkline
- Scatter Sparkline
- Bullet Sparkline
- Spread Sparkline
- Stacked Sparkline
- Hbar Sparkline
- Vbar Sparkline
- Box Plot Sparkline
- Vari Sparkline
- Cascade Sparkline
- Pareto Sparkline
- Month Sparkline
- Year Sparkline
- Custom Sparkline
- Rangeblock Sparkline
- Image Sparkline
- Histogram Sparkline
- Gauge KPI Sparkline
- Lollipop Variance Sparkline
- Progress Sparkline
- Tables
- Pivot Table
- Slicer
- Theme
- User Management
- Culture
- AI Assistant
- SpreadJS Designer
- SpreadJS Designer VSCode Plugin
- Tutorials
- SpreadJS Designer Component
- SpreadJS Collaboration Server
- Touch Support
- Formula Reference
- Import and Export Reference
- Events
- API Documentation
- Release Notes
Sparklines
A sparkline is a small chart that can be applied to quickly visualize data and transform it into a compact form in a cell. It uses data from a range of cells to help you easily analyze data at the cell level.
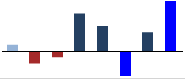
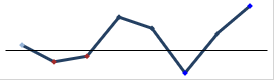
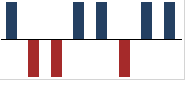
You can set the sparkline type to column, line, or winloss by using setSparkline method or use type-specific formulas to create different sparklines available in SpreadJS.
You can also implement your logic to define a custom sparkline formula with provided dataset and settings; add that custom sparkline using the addSparklineEx method.
Note: Sparklines created using formulas cannot be exported to an Excel file.
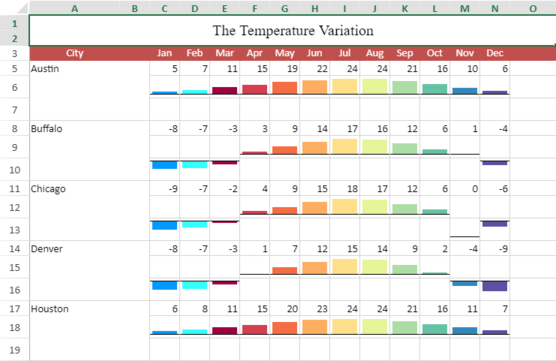
The image below shows the Vbar sparkline in action. It shows the trends in the temperature levels across a year in different cities and helps to quickly understand the high and low data points.
Types of Sparklines
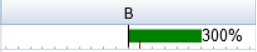
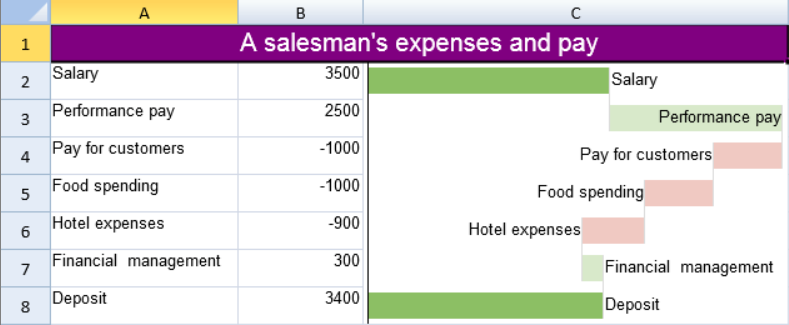
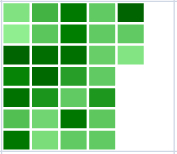
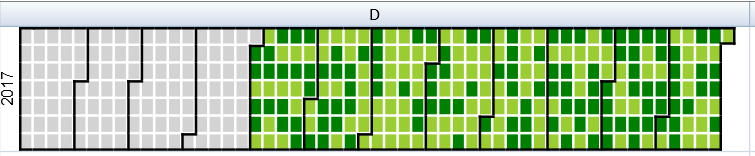
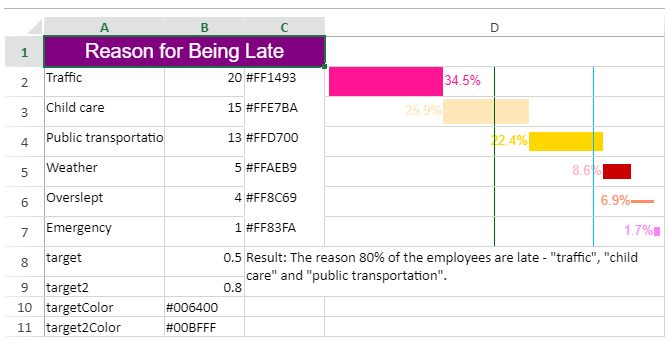
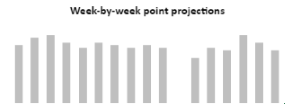
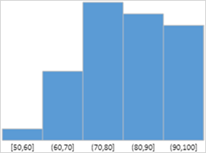
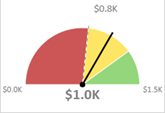
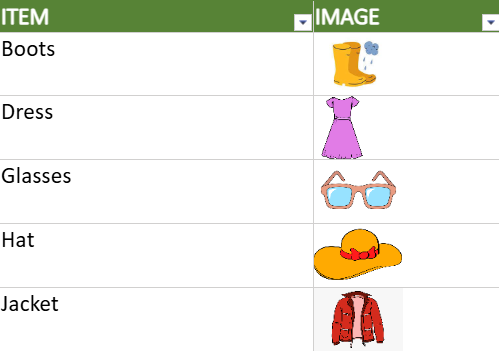
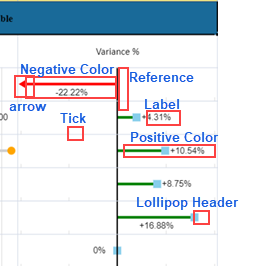
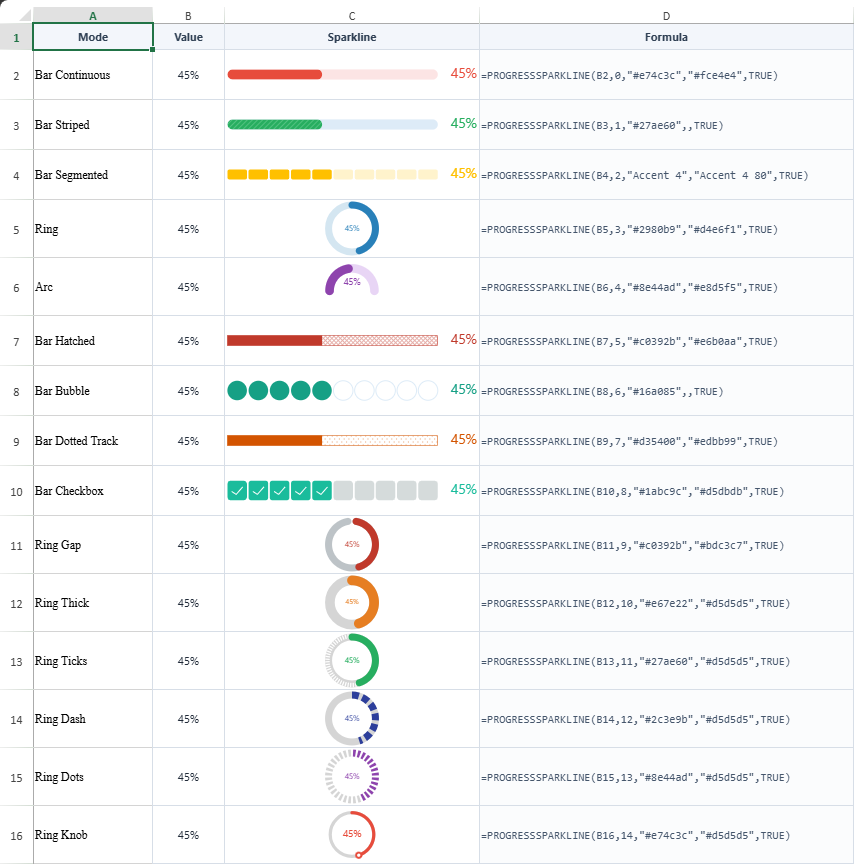
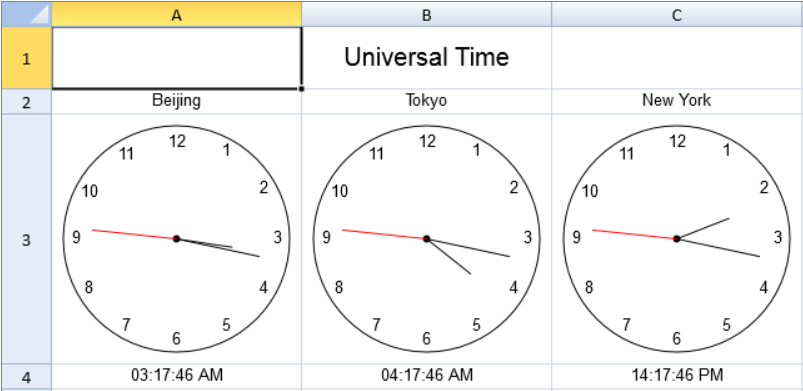
You can use the following sparkline types in your spreadsheet. Click on the images to visit the corresponding topics.
Types of Sparklines | |||
|---|---|---|---|
** Column Sparkline |
Line Sparkline |
Winloss Sparkline |
Area Sparkline |
|
Scatter Sparkline |
Bullet Sparkline |
Spread Sparkline |
Stacked Sparkline |
Hbar Sparkline |
Vbar Sparkline |
Box Plot Sparkline |
Vari Sparkline |
Cascade Sparkline |
Month Sparkline |
Year Sparkline |
Pareto Sparkline |
RangeBlock Sparkline |
Histogram Sparkline |
Gauge KPI Sparkline |
Image Sparkline |
Lollipop Variance Sparkline |
Progress Sparkline |
Custom Sparkline |
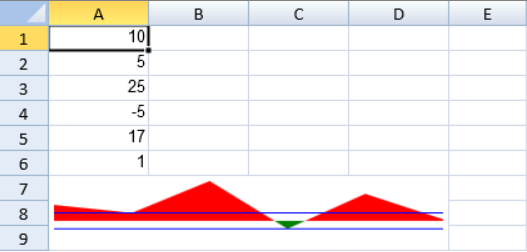
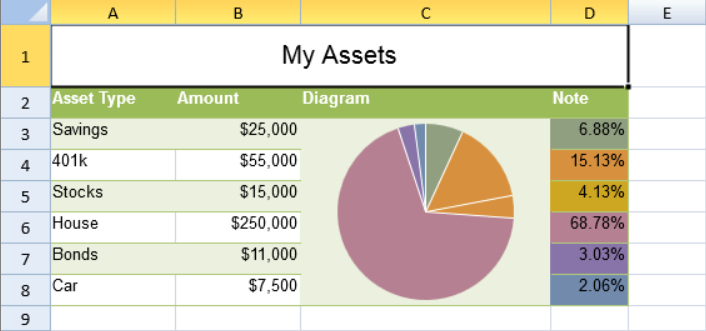
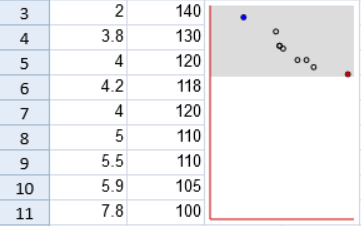
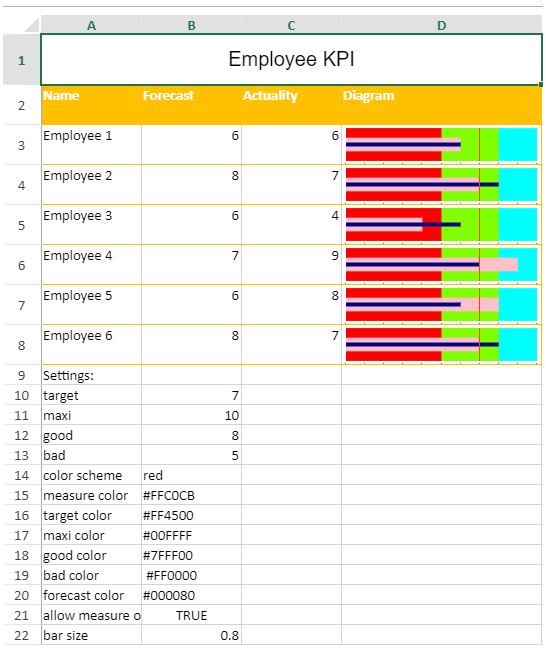
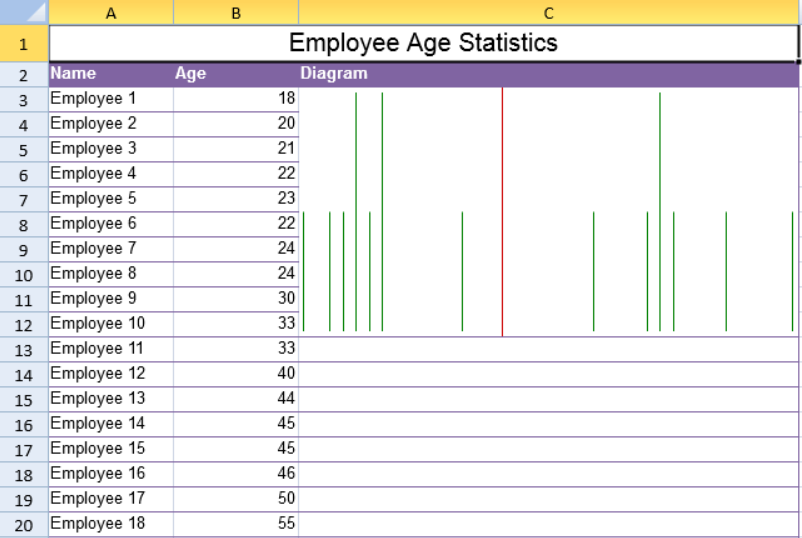
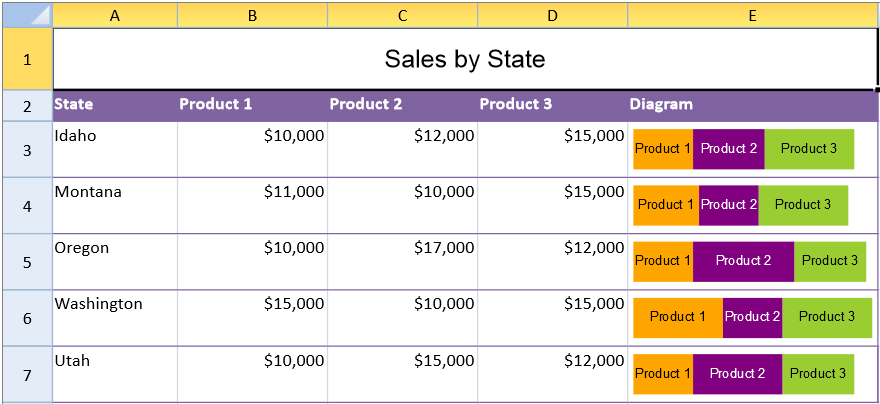
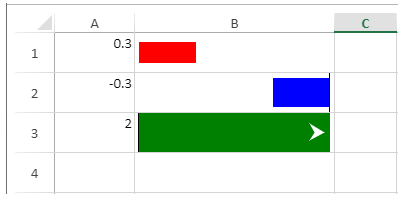
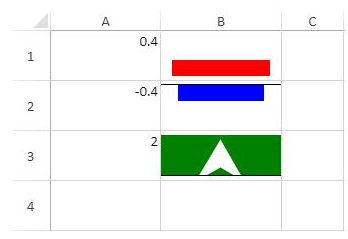

Grouping Sparklines
You can group and ungroup sparklines by using groupSparkline and ungroupSparkline methods.
Grouping enables you to apply changes to several sparklines all at once and saves time in the process. Grouping also helps to easily compare sparklines by using the same type of sparkline and axis in a group.
var spread = GC.Spread.Sheets.findControl(document.getElementById('ss'));
var sheet = spread.getActiveSheet();

var s1=  sheet.setSparkline(13, 0, data
        , GC.Spread.Sheets.Sparklines.DataOrientation.vertical
        , GC.Spread.Sheets.Sparklines.SparklineType.line
        , setting
        );
var s2 =sheet.setSparkline(13, 3, data
        , GC.Spread.Sheets.Sparklines.DataOrientation.vertical
        , GC.Spread.Sheets.Sparklines.SparklineType.column
        , setting
        );
var s3=  sheet.setSparkline(13, 6, data
        , GC.Spread.Sheets.Sparklines.DataOrientation.vertical
        , GC.Spread.Sheets.Sparklines.SparklineType.winloss
        , setting
        );

// group sparklines
var group = sheet.groupSparkline([s1,s2,s3]);

group.sparklineType = GC.Spread.Sheets.Sparklines.SparklineType.column;

// ungroup sparklines
sheet.ungroupSparkline(group);
Exporting Sparklines as Images
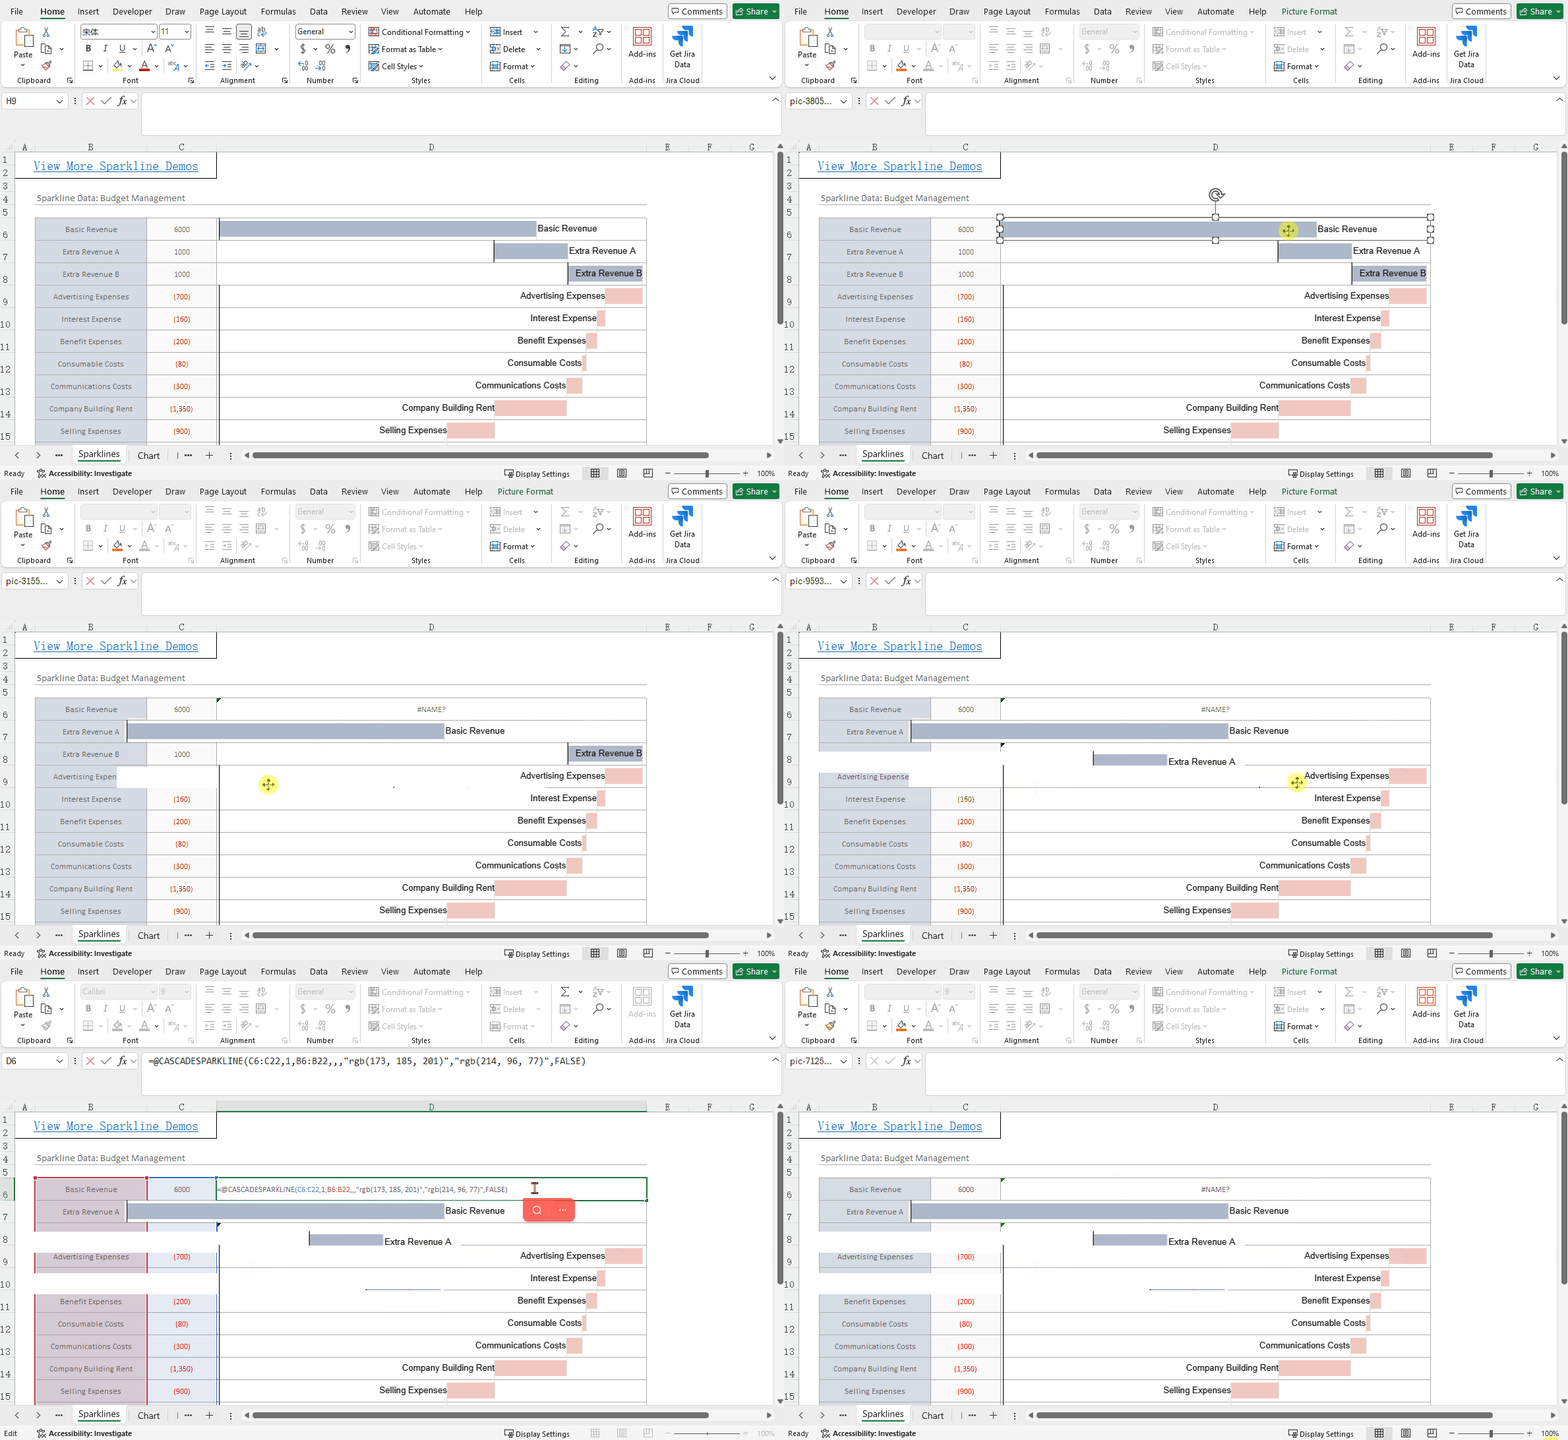
Microsoft Excel does not natively support SpreadJS Sparkline formulas. By default, exported Excel files contain the formulas, but the sparklines are not visually rendered.
To display sparklines in Excel, set the saveAsView option to true when exporting:
saveOptions.saveAsView = true;When enabled:
Sparklines are rendered as static images in the exported file.
The original formulas are preserved.
Updating data in Excel does not update the images.
If needed, you can exclude formulas using the includeFormulas option.
Performance: Enabling this option increases export time and file size, especially when many sparklines are present.
Supported in: Worksheet, TableSheet, GanttSheet, and ReportSheet.