
- SpreadJS Overview
- Getting Started
- JavaScript Frameworks
- Best Practices
-
Features
- Workbook
- Worksheet
- Rows and Columns
- Headers
- Cells
- Data Binding
- Data Manager
- TableSheet
- GanttSheet
- ReportSheet
- Data Charts
- JSON Schema with SpreadJS
- SpreadJS File Format
- Data Validation
- Conditional Formatting
- Sort
- Group
- Formulas
- What-If Analysis
- Serialization
- Keyboard Actions
- Shapes
- Floating Objects
- Barcodes
- Charts
- Sparklines
- Tables
- Pivot Table
- Slicer
- Theme
- User Management
- Culture
- AI Assistant
- SpreadJS Designer
- SpreadJS Designer VSCode Plugin
- Tutorials
- SpreadJS Designer Component
- SpreadJS Collaboration Server
- Touch Support
- Formula Reference
- Import and Export Reference
- Events
- API Documentation
- Release Notes
Data Charts
Data Charts in SpreadJS are chart components that visualize data managed by the SpreadJS Data Manager. Unlike traditional charts that rely on worksheet cell ranges, Data Charts bind directly to Data Manager tables and use field-based data mappings to define chart structure.
Because they operate independently of worksheet grids, Data Charts are designed for data-driven applications where chart data is managed outside the spreadsheet cells.
Data Charts and Data Manager
Data Charts require a Data Manager table as their data source. Chart data is defined by referencing table fields rather than cell ranges.
This architecture provides:
A clear separation between data storage and presentation
Flexible field-based data binding
Support for structured and hierarchical data mappings
Data Charts do not read from or store data in worksheet cells.
Refer to the Data Manager for detailed information.
Key Capabilities
Dynamic Data Binding - Charts are bound directly to Data Manager tables, eliminating the need for fixed cell ranges.
**Advanced Configuration and Styling -**Data Charts support flexible plot definitions, encoding mappings, and customizable visual settings.
Creating a Data Chart
You can create a Data Chart using:
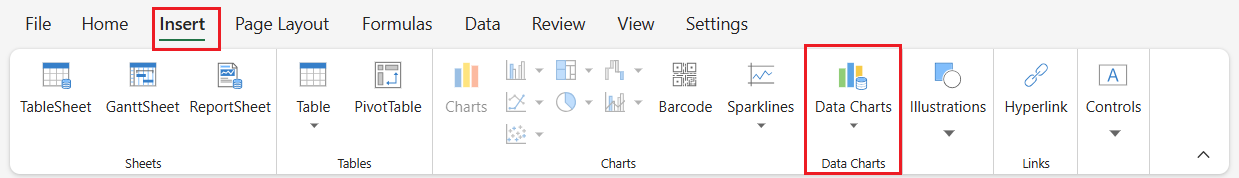
Runtime API – Add a chart using the GC.Spread.Sheets.DataCharts.DataChart class and configure it with
setChartConfig.SpreadJS Designer Component – Insert a Data Chart from the INSERT tab by selecting Data Charts.
For step-by-step instructions, see:
Compatibility and Licensing
Data Charts and Excel charts are not compatible. When exported to Excel, a Data Chart is converted to an image.
Data Charts are provided as an add-on feature. A valid SpreadJS license, including the Data Charts feature, is required to remove the watermark in production use.