
- SpreadJS Overview
- Getting Started
- JavaScript Frameworks
- Best Practices
- Features
- SpreadJS Designer
- SpreadJS Designer VSCode Plugin
- Tutorials
-
SpreadJS Designer Component
- Getting Started
- Quick Start
- Theme
- Designer Interface
- JavaScript Frameworks
- Template-Based Workbook Initialization
- Customizations
-
Work in Designer Component
- AutoSum Functions
- Set Range Template Cell
- Name Box
- Select Cells Using Go To
- Find and Replace
- Edit Font Size
- Edit Font Family
- Manage Conditional Formatting Rules
- Shape Selection Pane
- Automatic Outline
- Format Painter
- Table Slicer
- Data Source
- TableSheet
- GanttSheet Designer
- ReportSheet Designer
- Data Chart Designer
- Text to Columns
- Remove Duplicates
- Pivot Table
- Dockable Side Panel
- Command Palette
- Transform Cells with LAMBDA Formula
- Threaded Comments Panel
- What-If Analysis
- Insert Function Dialog
- Named Cell Templates
- Insert Pictures in Designer
- Toolbar Ribbon
- API Documentation
- SpreadJS Collaboration Server
- Touch Support
- Formula Reference
- Import and Export Reference
- Events
- API Documentation
- Release Notes
Data Chart Designer
SpreadJS Designer Component lets you insert a Data Chart and configure it through the Data Chart Panel.
To add a Data Chart, follow these steps:
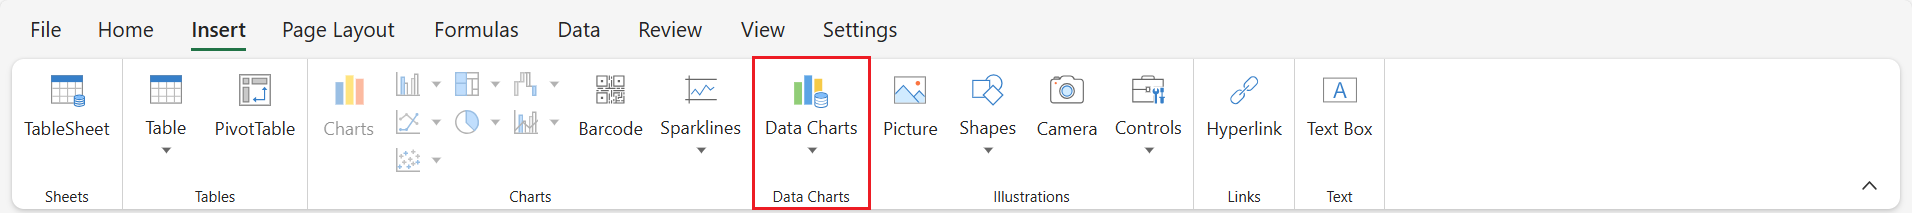
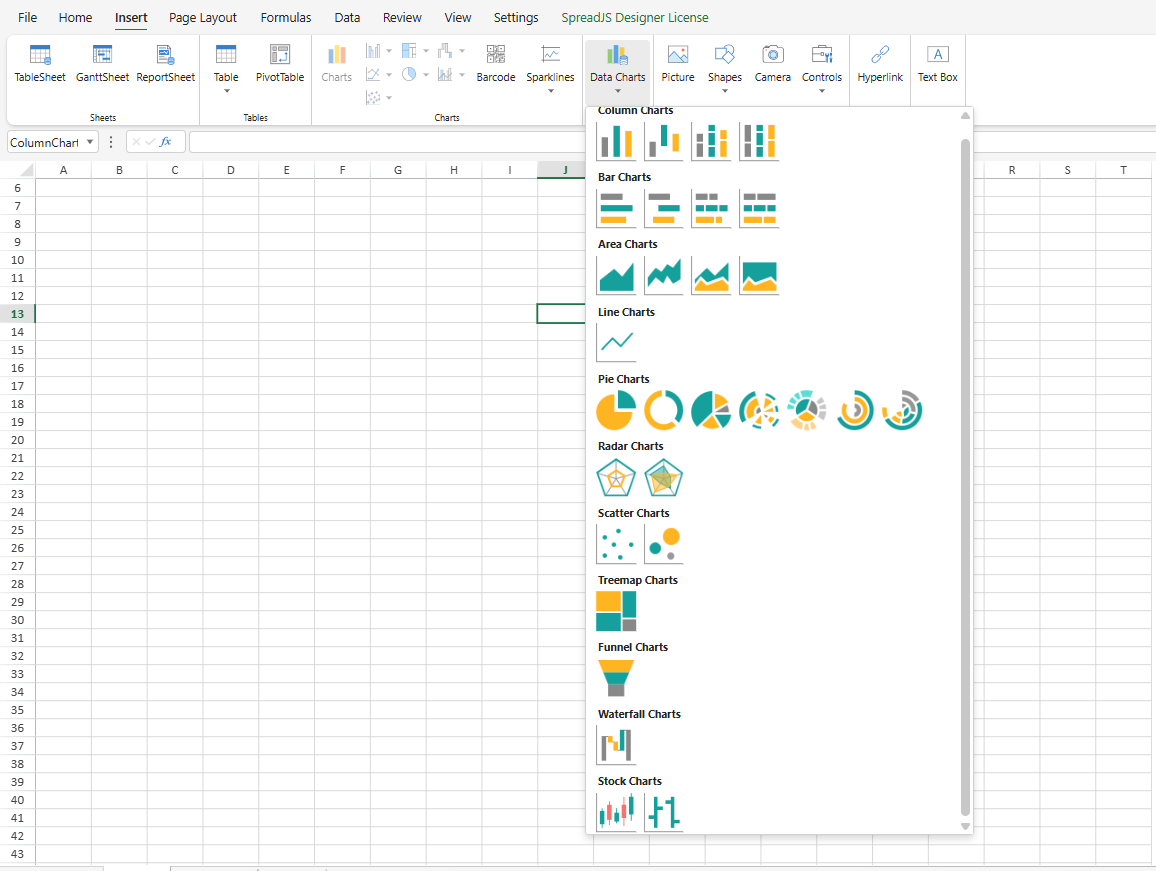
Go to the INSERT tab and click the Data Charts button in the ribbon UI.
Select the desired chart type from the dropdown.
Once selected, the Data Chart is added to the current sheet and the Data Chart Panel opens on the right.
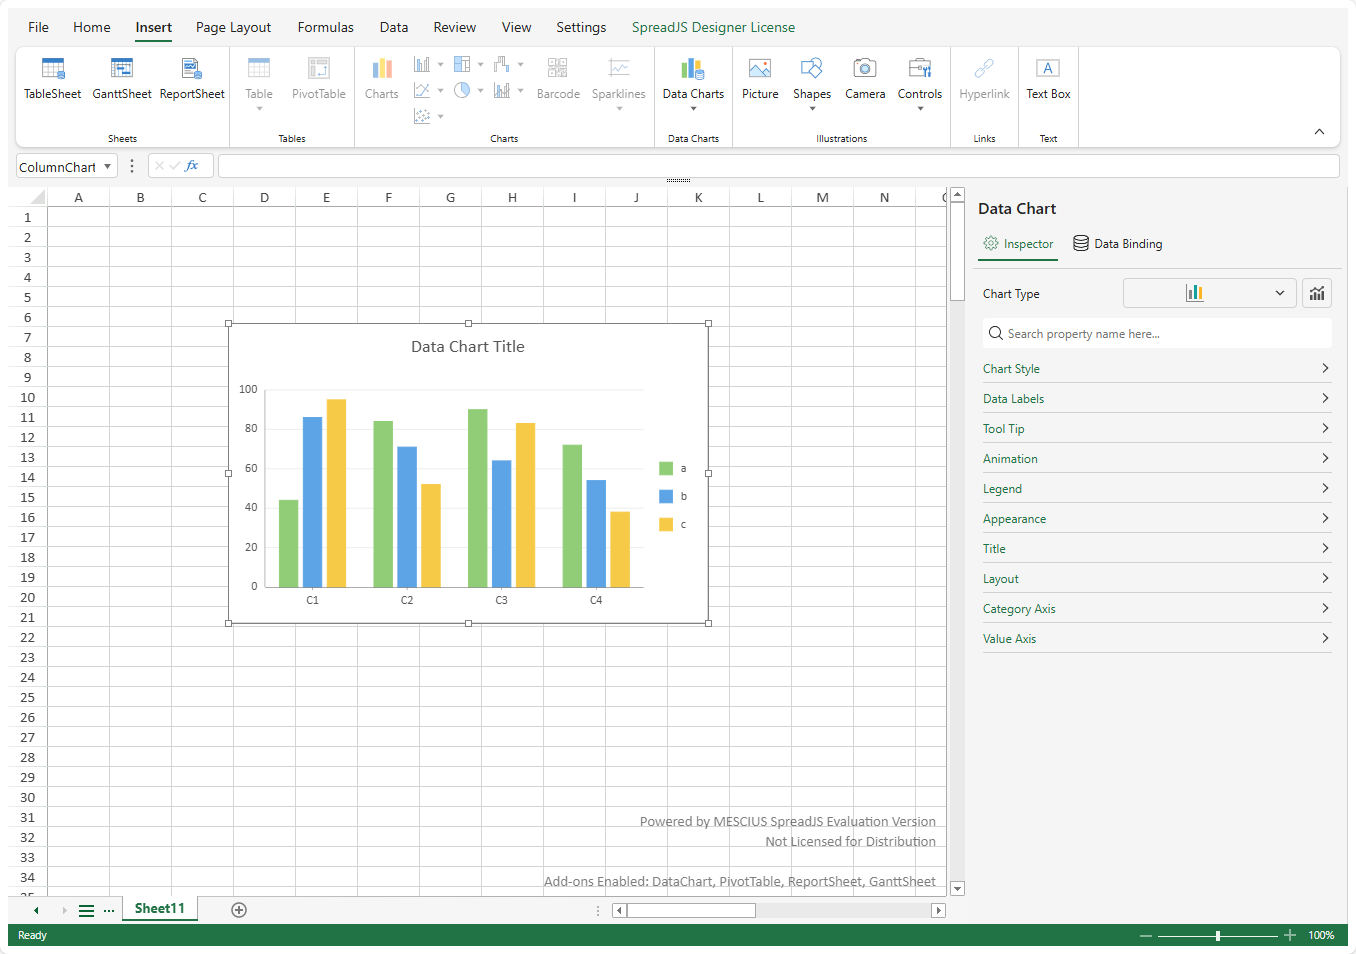
Configure the chart by using the Data Chart Panel.
The panel has two main sections:
Inspector - This section allows you to customize the chart’s appearance and make it more readable and visually appealing.
Data Binding - This section helps you bind your chart to data from the DataManager or specific cells in a ReportSheet. The data displayed in the Data Chart is setup through this part.