
- SpreadJS Overview
- Getting Started
- JavaScript Frameworks
- Best Practices
- Features
- SpreadJS Designer
- SpreadJS Designer VSCode Plugin
- Tutorials
-
SpreadJS Designer Component
- Getting Started
- Quick Start
- Theme
- Designer Interface
- JavaScript Frameworks
- Template-Based Workbook Initialization
- Customizations
-
Work in Designer Component
- AutoSum Functions
- Set Range Template Cell
- Name Box
- Select Cells Using Go To
- Find and Replace
- Edit Font Size
- Edit Font Family
- Manage Conditional Formatting Rules
- Shape Selection Pane
- Automatic Outline
- Format Painter
- Table Slicer
- Data Source
- TableSheet
- GanttSheet Designer
- ReportSheet Designer
- Data Chart Designer
- Text to Columns
- Remove Duplicates
- Pivot Table
- Dockable Side Panel
- Command Palette
- Transform Cells with LAMBDA Formula
- Threaded Comments Panel
- What-If Analysis
- Insert Function Dialog
- Named Cell Templates
- Insert Pictures in Designer
- Toolbar Ribbon
- API Documentation
- SpreadJS Collaboration Server
- Touch Support
- Formula Reference
- Import and Export Reference
- Events
- API Documentation
- Release Notes
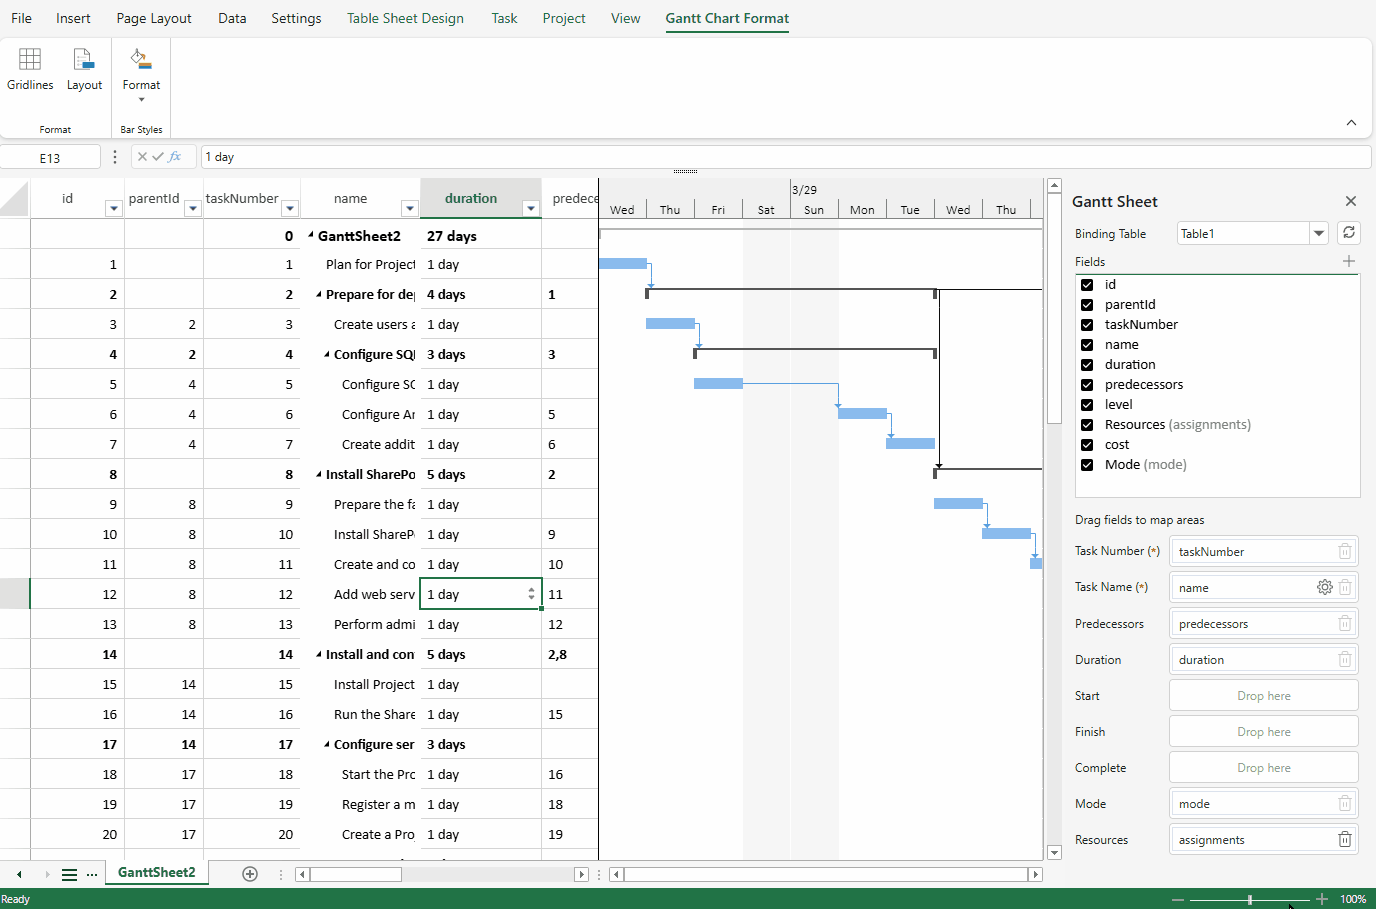
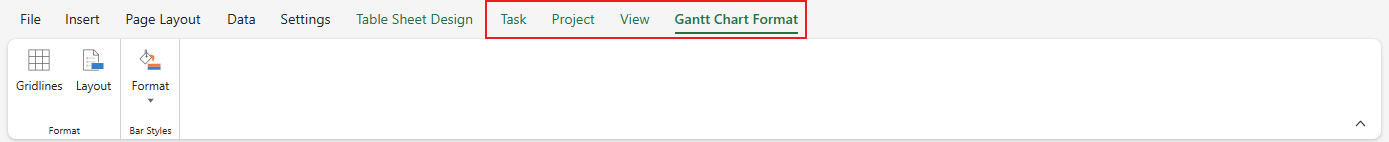
GanttSheet Designer
SpreadJS Designer Component provides the option to insert and configure a GanttSheet in a workbook.
A GanttSheet binds to a table and aligns the table schema with the Gantt data model through field mapping and initialization rules.
Insert a GanttSheet
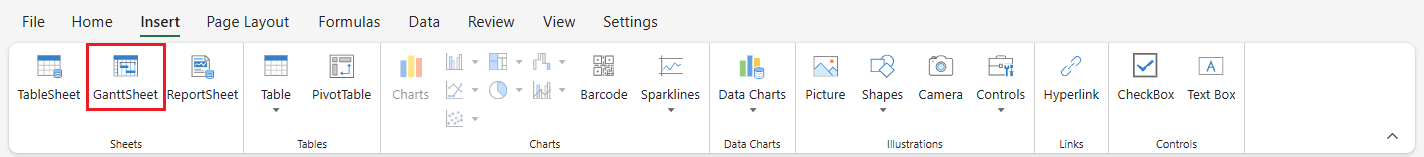
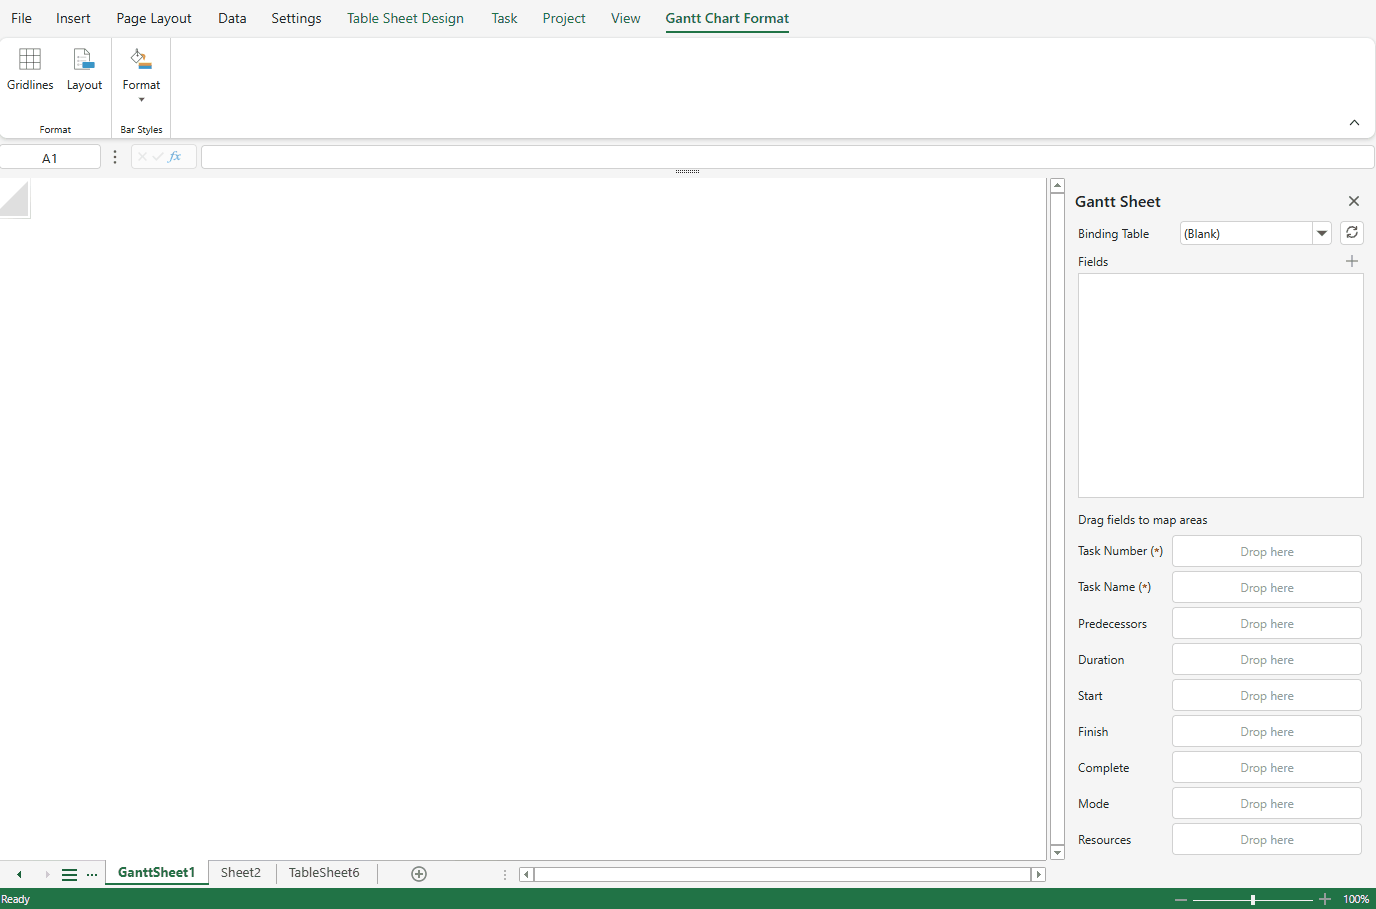
The GanttSheet button is available in the INSERT > Sheets tab group.
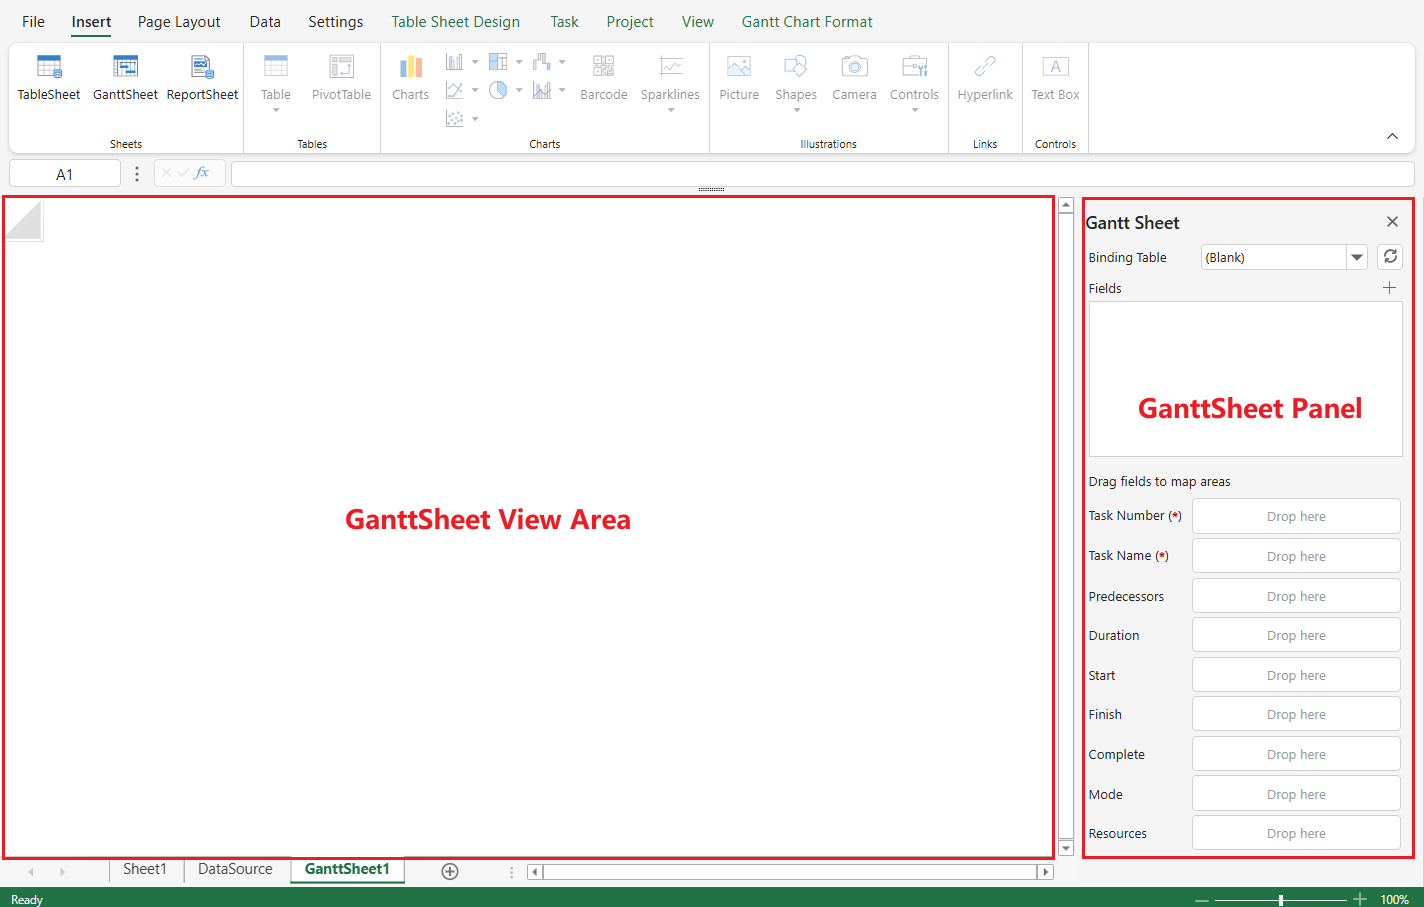
Clicking GanttSheet:
Adds a new GanttSheet (for example, GanttSheet1) to the workbook.
Opens the Gantt Chart Format tab.
Displays the GanttSheet view area (left) and the Gantt Sheet panel (right).
Bind and Initialize Data
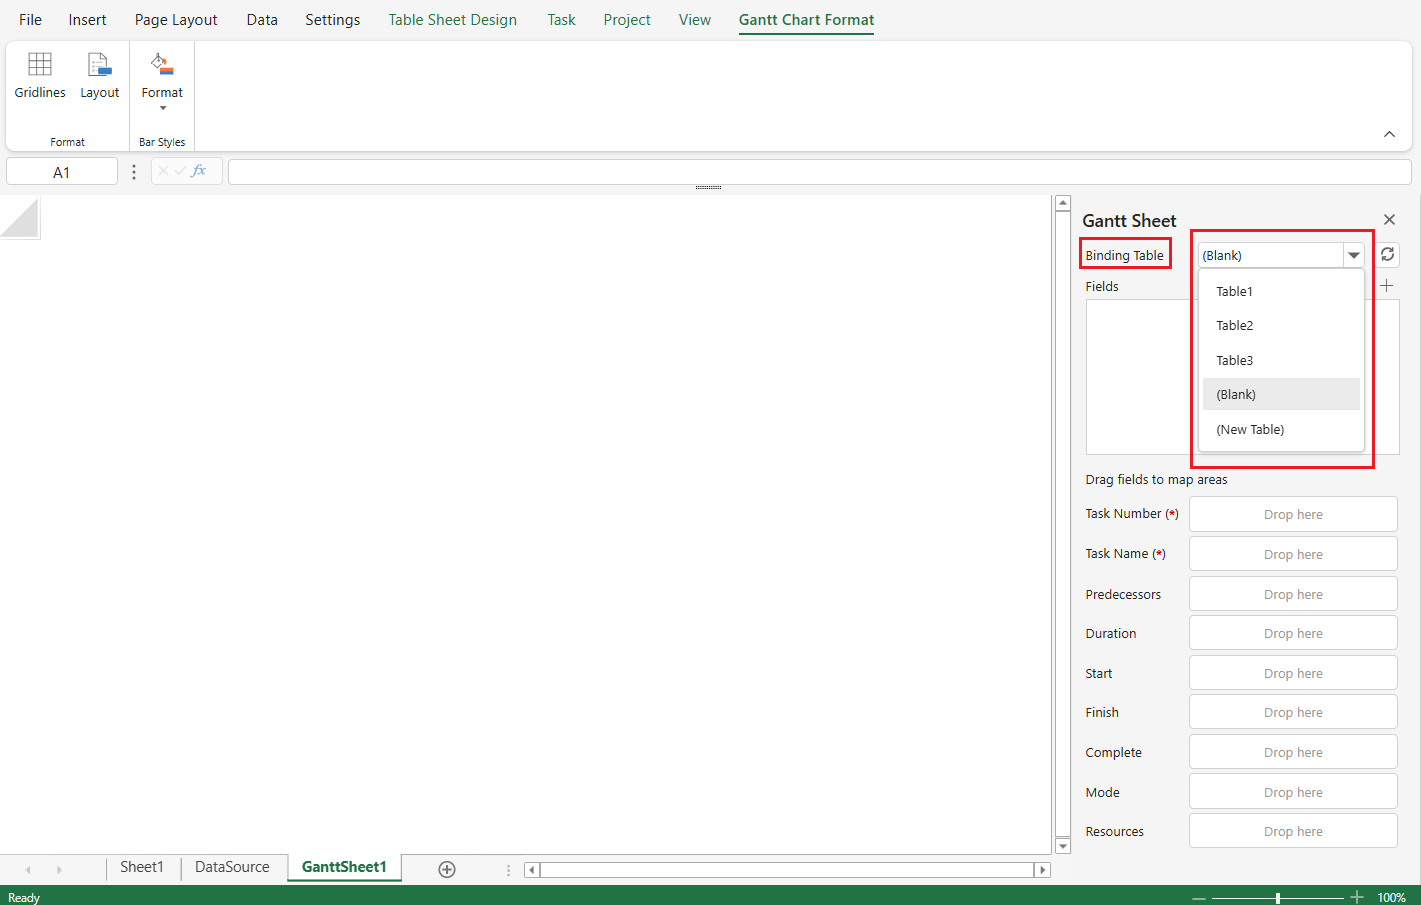
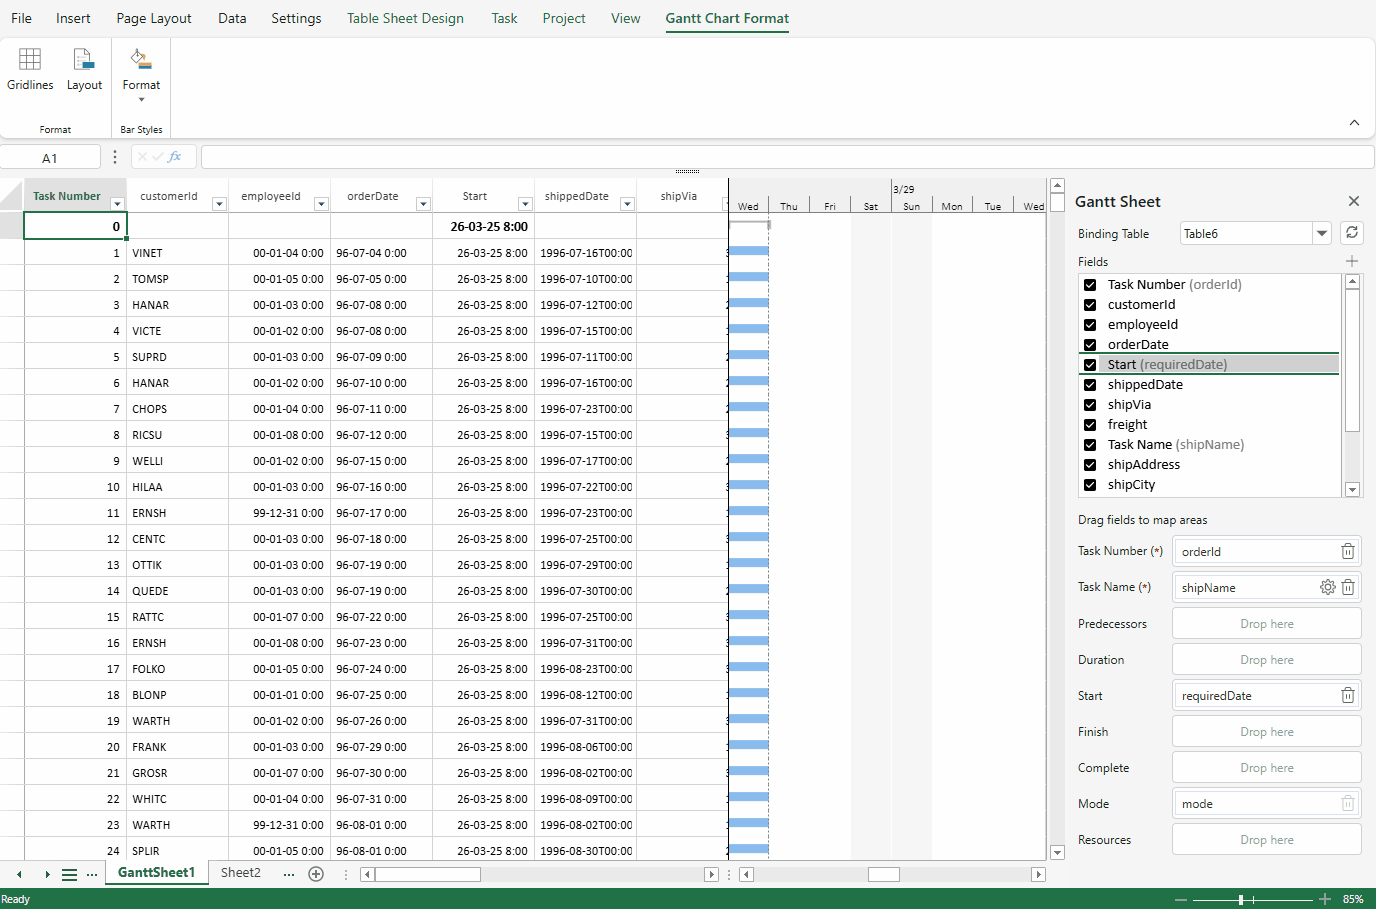
A GanttSheet must bind to a table defined in the DataSource.
To bind a table:
Open the Binding Table drop-down in the Gantt Sheet panel.
Select an existing table or choose (New Table) to create one.
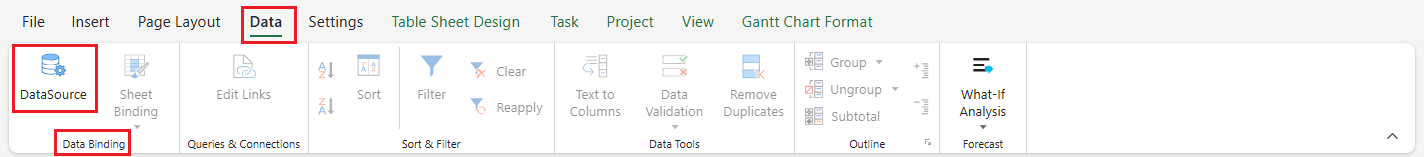
Tables can be defined and managed from DATA > Data Binding > DataSource, where you can:
Define schema types
Configure relationships
Configure external CRUD URLs
Add calculated columns
Once a table is selected, the GanttSheet initializes its internal data model and attempts to resolve field mappings automatically.
Default Task Mode
If the selected table does not contain a task mode field, a dialog prompts you to choose a default task mode.
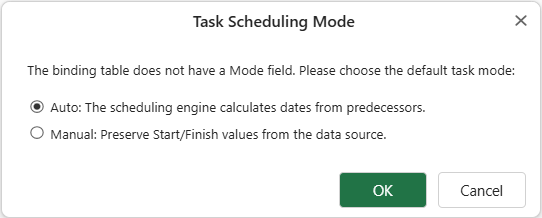
Auto – Scheduling mode.
Task start and finish dates may be calculated by the scheduling engine based on dependencies, constraints, and scheduling rules.
Manual – Timeline mode.
Task bars are rendered directly from the mapped start and finish fields without scheduling recalculation.
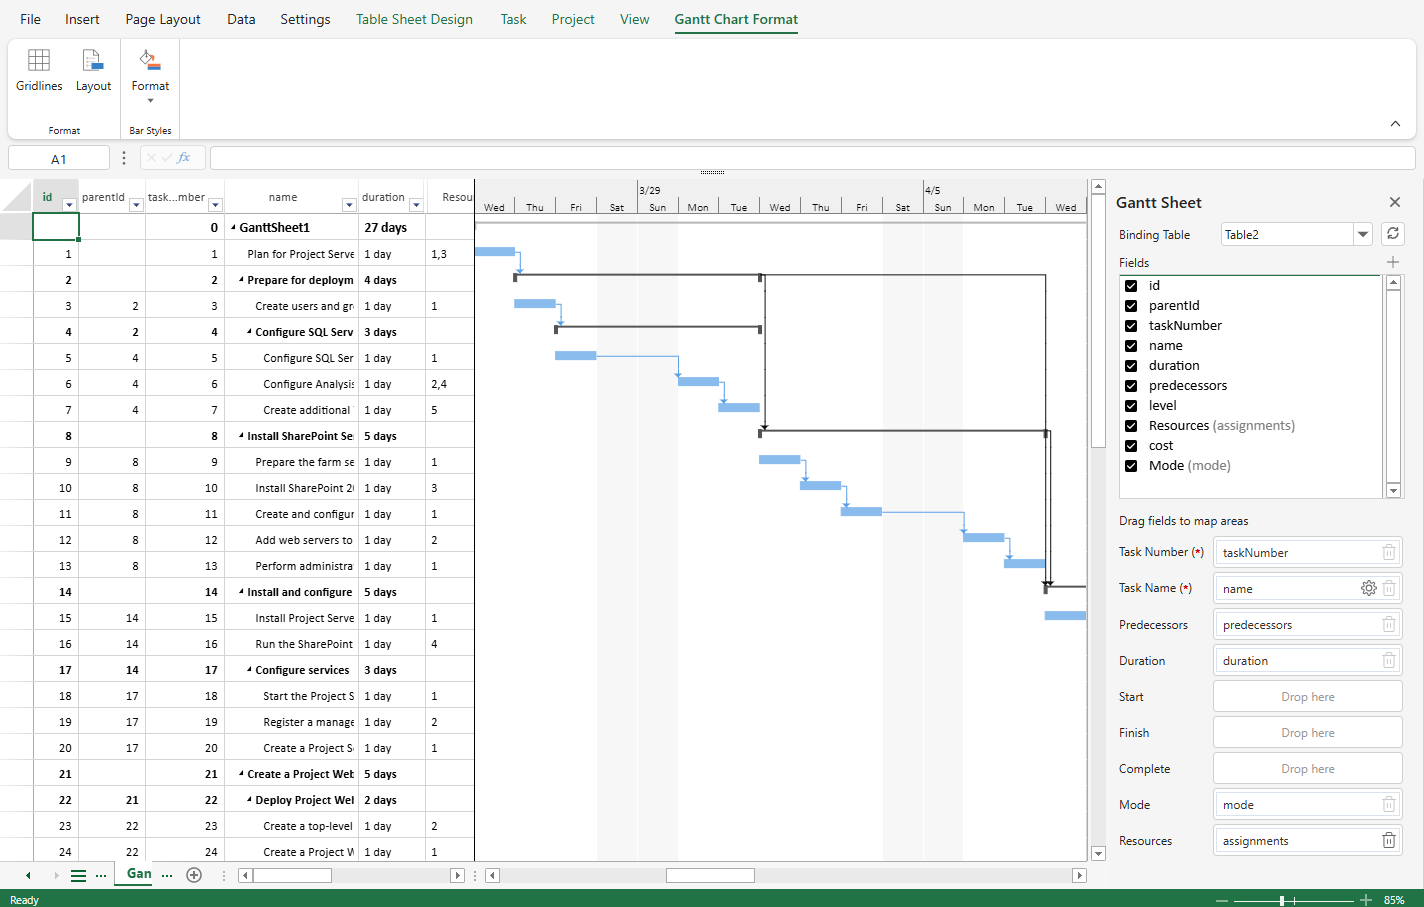
Below shows the GanttSheet initialization results for the Table2 when defaultMode is set to Auto versus Manual.
Auto
Manual
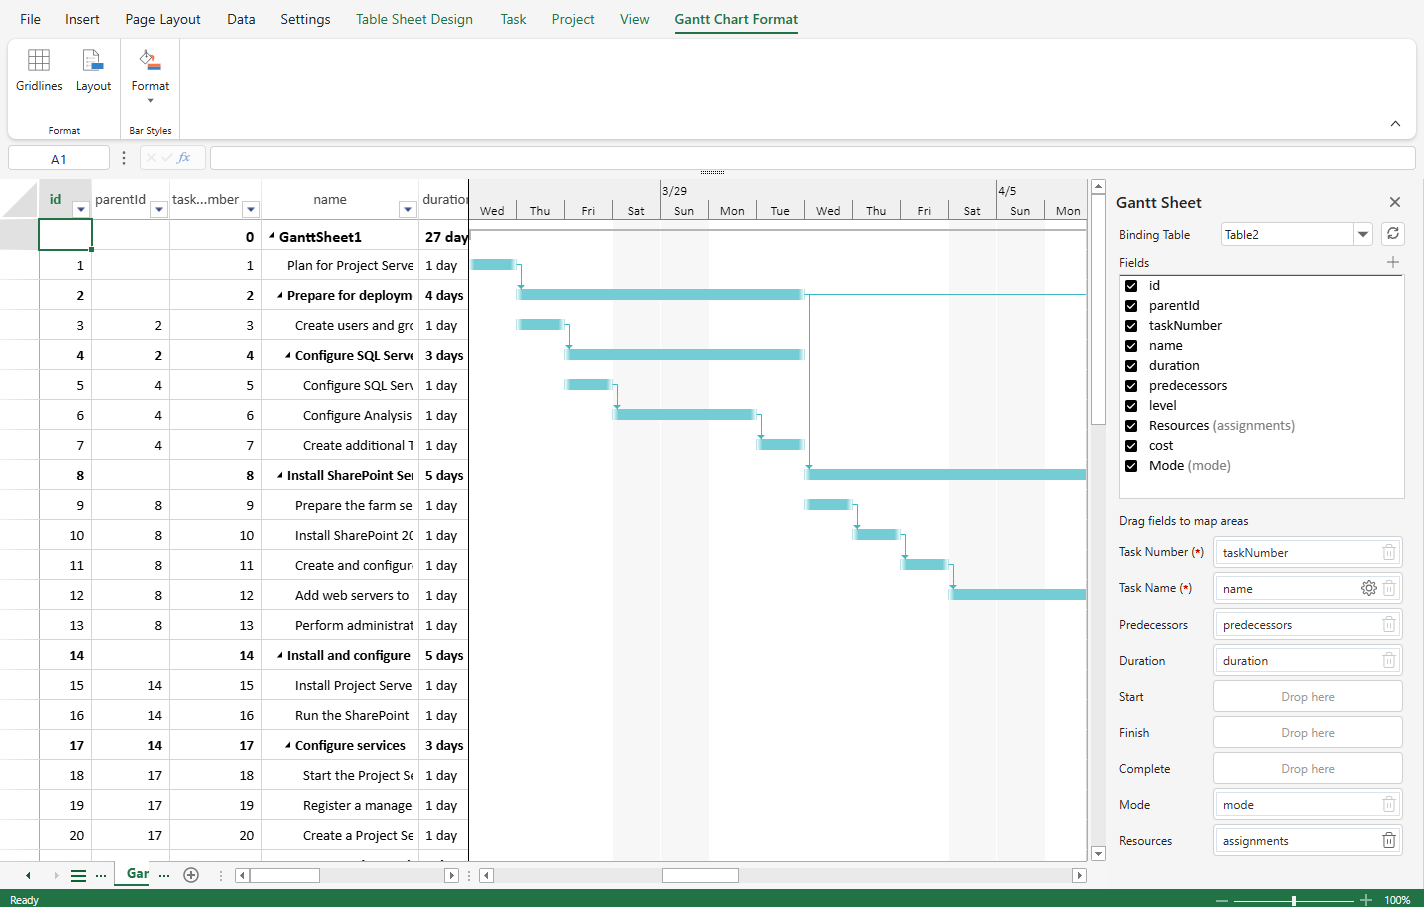
This setting determines how tasks are initialized when the GanttSheet first binds to the table.
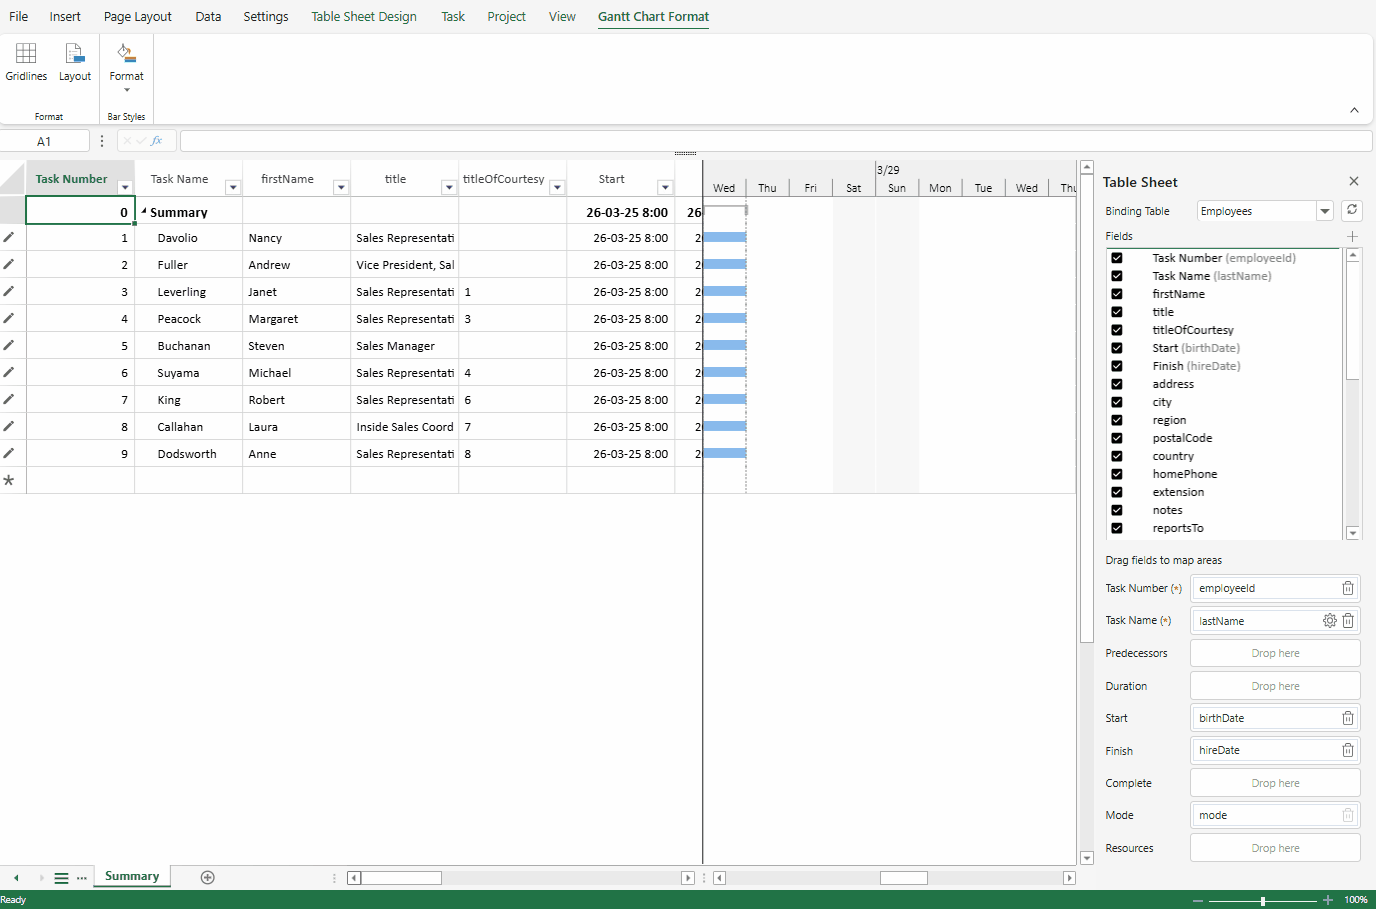
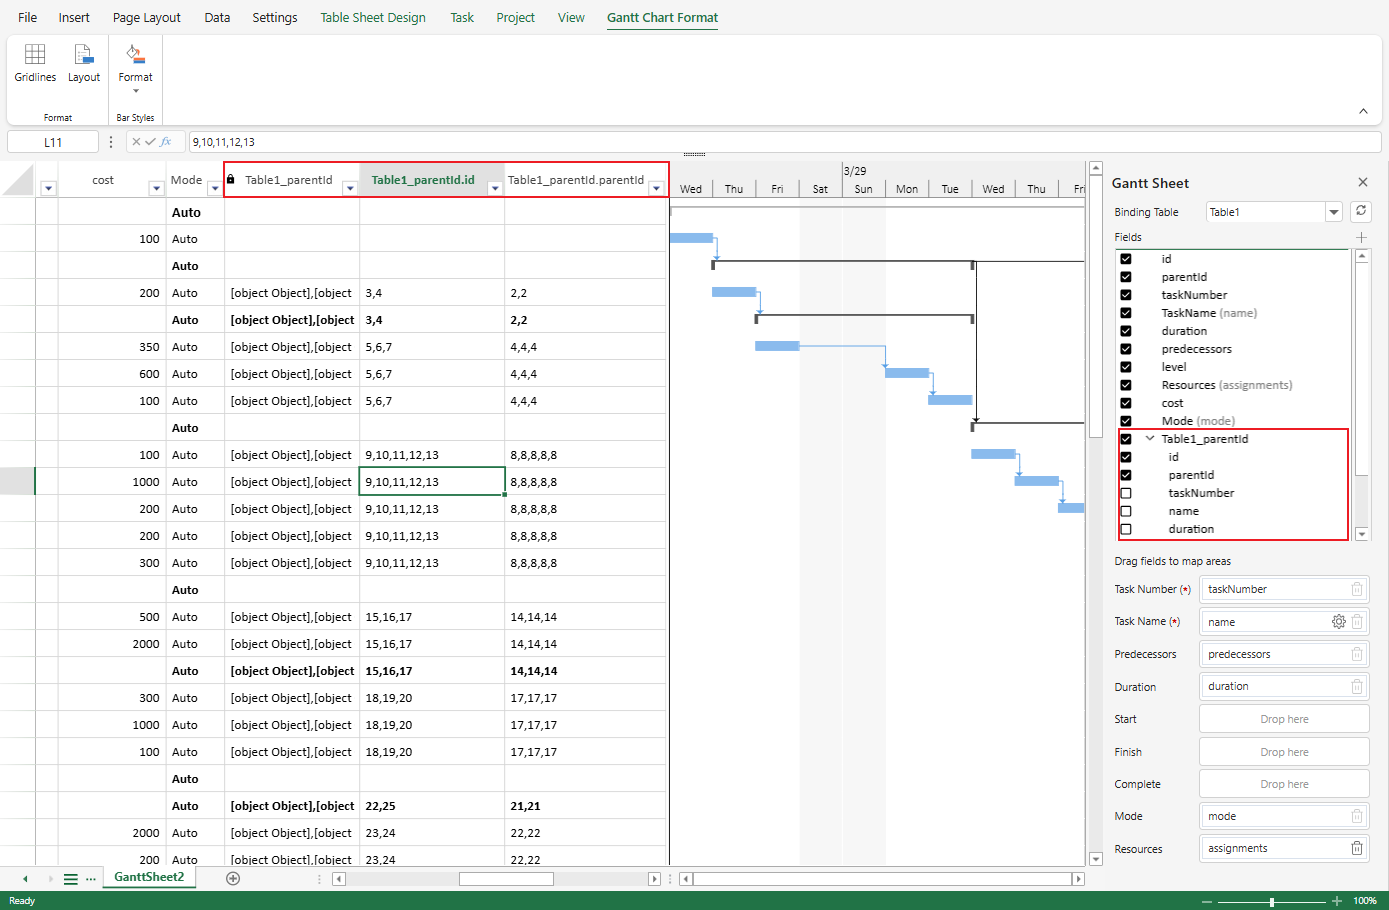
Field Mapping
Field mapping defines how the table schema aligns with the Gantt data model.
The GanttSheet requires specific logical fields (such as task identity and display name). These logical fields must be mapped to physical columns in the selected table.
The Gantt Sheet panel contains:
Fields List – All available fields from the bound table.
Drag fields to map areas – Gantt-specific logical fields that require mapping.
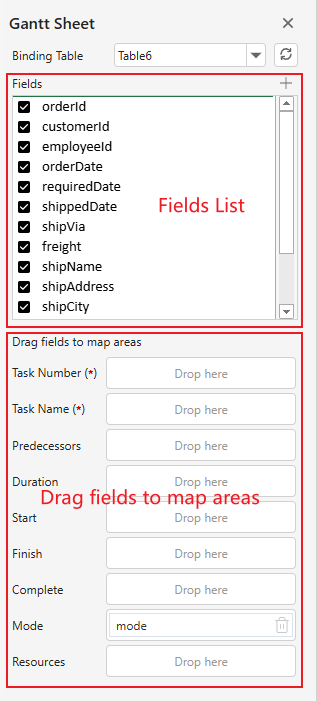
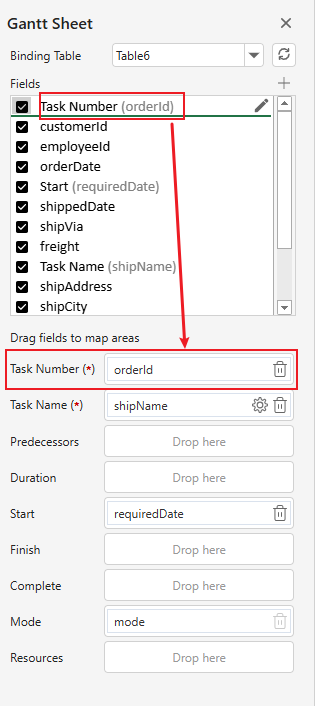
Required Fields
The following fields are required:
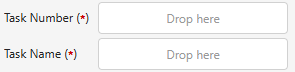
Task Number
Task Name
Required fields are marked with (*).
The GanttSheet cannot function correctly unless these fields are mapped.
Auto-Mapping Behavior
When a table is bound for the first time, SpreadJS attempts to generate mapping suggestions automatically.
Auto-mapping is based on:
Exact field-name match
Naming conventions
Compatible data types
Strict Field-Name Match
If a table field name exactly matches a required Gantt field name, it is treated as a strict match.
Strict matches:
Are locked
Cannot be removed
Cannot be remapped
Have the Remove button disabled
This ensures schema stability when the table already conforms to the expected Gantt model.

Intelligent Inference
If a field is inferred based on naming patterns or data type compatibility:
The mapping can be removed
The mapping can be changed via drag-and-drop
If no suitable match is inferred, the field remains unmapped and must be configured manually.
Drag-and-Drop Mapping
Mappings can be configured or modified using drag-and-drop:
Drag a field from the Fields List to a logical Gantt field.
Drag a mapped field to another logical field to remap it.
Click Remove to clear a mapping.
Drag a mapped field outside the panel to remove it.
When remapping within the mapping area:
The target field is updated.
The source field is cleared.
Caption Assignment
For automatically inferred or manually mapped fields:
If the mapped table field does not define a caption in the DataSource, the GanttSheet assigns a default caption based on the logical Gantt field name (for example, mapping birthDate to Start sets the caption to Start).
Configure Task Structure
Task structure defines how tasks are organized and how dependencies are interpreted.
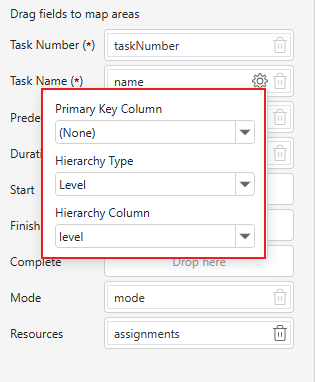
Set Hierarchy
Hierarchy determines how tasks are displayed in a parent–child tree structure.
To configure hierarchy:
Click the Settings button on the Task Name mapping field.
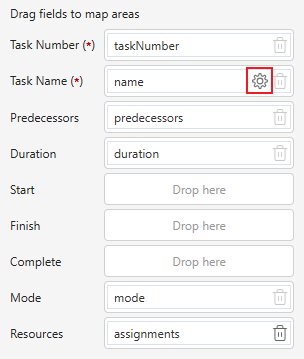
Define the parent–child relationship in the dialog.
After configuration:
Task names are rendered as a tree.
The Gantt chart reflects the hierarchical structure.
Auto-Infer Predecessors
When:
A field is mapped to Predecessor, or
Hierarchy is configured,
SpreadJS automatically infers predecessor relationships for tasks.
The generated predecessor data is written back to the mapped predecessor field in the underlying data source.
Auto-mapping, hierarchy configuration, or predecessor inference may modify data in the bound table.
Relationships in the Fields List
If the table contains defined relationships:
Related columns are indicated with a linked icon in the Fields List.
Relationship nodes can be expanded to view child fields.
When inserting relationship columns, hierarchical naming may be reflected using dot notation (for example: myTable1_Id.id).
Modify Column Settings
To modify column settings:
Select a column in the GanttSheet view.
The Column Setting tab opens.
Adjust properties such as:
Caption
Value
Column name
Data type
Styles
These settings affect presentation but do not change the underlying field mapping model.
Additional GanttSheet Tabs
GanttSheet provides additional functionality through Ribbon tabs:
Topic | Description |
|---|---|
Perform task-level operations. | |
Configure project-level settings. | |
Control sorting and timescale display. | |
Customize taskbar appearance and formatting. |