
- SpreadJS Overview
- Getting Started
- JavaScript Frameworks
- Best Practices
- Features
- SpreadJS Designer
- SpreadJS Designer VSCode Plugin
- Tutorials
-
SpreadJS Designer Component
- Getting Started
- Quick Start
- Theme
- Designer Interface
- JavaScript Frameworks
- Template-Based Workbook Initialization
- Customizations
-
Work in Designer Component
- AutoSum Functions
- Set Range Template Cell
- Name Box
- Select Cells Using Go To
- Find and Replace
- Edit Font Size
- Edit Font Family
- Manage Conditional Formatting Rules
- Shape Selection Pane
- Automatic Outline
- Format Painter
- Table Slicer
- Data Source
- TableSheet
- GanttSheet Designer
- ReportSheet Designer
- Data Chart Designer
- Text to Columns
- Remove Duplicates
- Pivot Table
- Dockable Side Panel
- Command Palette
- Transform Cells with LAMBDA Formula
- Threaded Comments Panel
- What-If Analysis
- Insert Function Dialog
- Named Cell Templates
- Insert Pictures in Designer
- Toolbar Ribbon
- API Documentation
- SpreadJS Collaboration Server
- Touch Support
- Formula Reference
- Import and Export Reference
- Events
- API Documentation
- Release Notes
View Tab
The VIEW tab of the GanttSheet offers a range of functionalities to enhance the user experience and customization options to manage Gantt charts effectively.

Sort Options
The Sort button available in the Data group provides options to arrange GanttSheet data according to specific criteria for better organization and analysis.
There are three predefined sorting options, such as by Start Date, by End Date, and by Task Number. To customize, select Sort by... and apply the required option from the Sort dialog as shown below.
Ascending
Descending
Keep Outline Structure
Permanently Renumber Tasks

For more information on the sorting feature, you can also refer to GanttSheet > Sort.
Zoom Options
The zoom feature enables you to adjust the level of magnification for the Gantt chart. It allows you to get a zoom-in or zoom-out view of the project data.
You can apply the following zoom options:

Timescale Settings
The Timescale setting is present inside the Zoom group of the VIEW tab. It represents the column header of a Gantt chart and allows you to configure the presentation of time intervals within the Gantt chart.

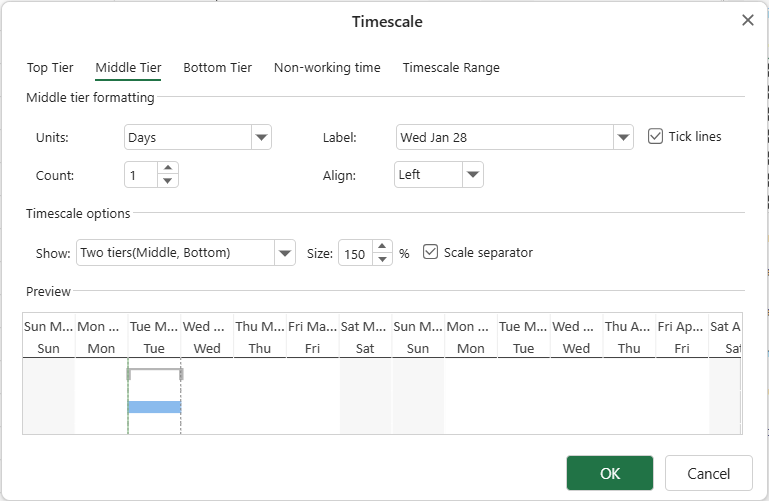
Miiddle Tier
You can select the required timescale intervals from the list. However, if you select the Timescale... option, you can modify the display of timescale information by selecting the appropriate tier and formatting options from the related tab page.
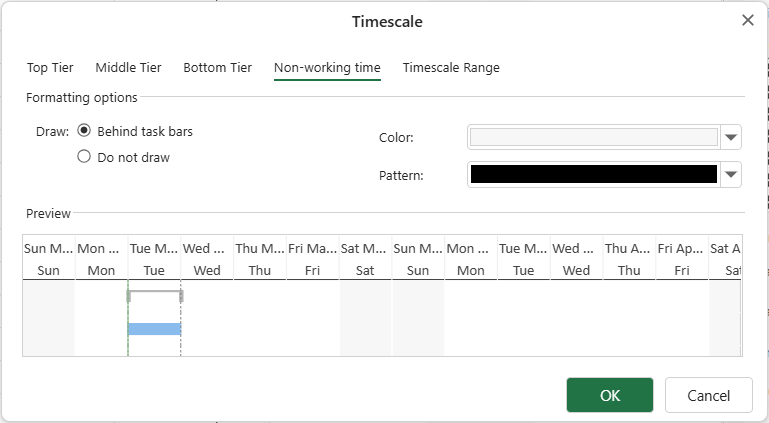
Non-working time
Additionally, you can define non-working time in the Gantt chart to get more flexibility when scheduling and allocating resources. Non-working time can be displayed before, after, or without the task bar, and also has options to change the colors and patterns for better visual distinction.
Auto Fit Mode = None
In this mode:
Min Date and Max Date are editable.
The timescale range remains fixed.
Scheduling does not automatically modify the date boundaries.
This mode allows you to manually define a stable date range.
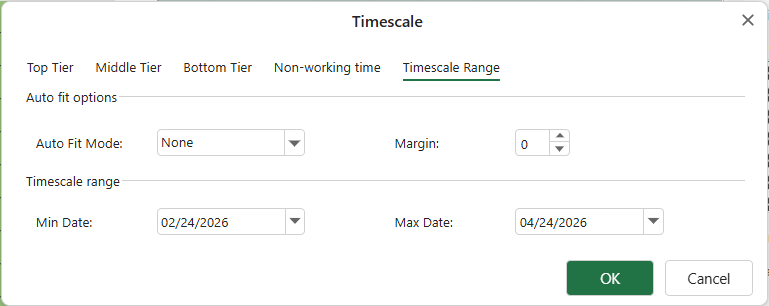
Auto Fit Mode = Project
The timescale range automatically follows the project’s scheduled duration.
Min Date and Max Date become read-only in the Designer.
The date boundaries are updated after each schedule.

Margin Setting
The Margin option remains configurable in both modes.
Margin defines how many minimum tier units are reserved:
Before the start of the timescale range
After the end of the timescale range
This prevents the chart from becoming visually tight at the boundaries and helps avoid clipping of task labels.
For more information about timescale and non-working time, you can also refer to Gantt Chart Components and Non-Working Time.