


- SpreadJS Overview
- Getting Started
- JavaScript Frameworks
- Best Practices
- Features
- SpreadJS Designer
- SpreadJS Designer VSCode Plugin
- Tutorials
-
SpreadJS Designer Component
- Getting Started
- Quick Start
- Theme
- Designer Interface
- JavaScript Frameworks
- Template-Based Workbook Initialization
- Customizations
-
Work in Designer Component
- AutoSum Functions
- Set Range Template Cell
- Name Box
- Select Cells Using Go To
- Find and Replace
- Edit Font Size
- Edit Font Family
- Configure Cell Borders
- Manage Conditional Formatting Rules
- Shape Selection Pane
- Automatic Outline
- Format Painter
- Sort and Filter
- Table Slicer
- Data Source
- TableSheet
- GanttSheet Designer
- ReportSheet Designer
- Data Chart Designer
- Text to Columns
- Remove Duplicates
- Pivot Table
- Dockable Side Panel
- Command Palette
- Transform Cells with LAMBDA Formula
- Threaded Comments Panel
- What-If Analysis
- Insert Function Dialog
- Named Cell Templates
- Insert Pictures in Designer
- Toolbar Ribbon
- API Documentation
- SpreadJS Collaboration Server
- Touch Support
- Formula Reference
- Import and Export Reference
- Events
- API Documentation
- Release Notes
Pivot Table
In SpreadJS, a pivot table is a powerful tool that allows you to summarize and analyze large amounts of data in a structured and organized manner. It enables you to reorganize and present your data in a more meaningful way without altering the original data set.
In the SpreadJS Designer Component, the PivotTable button is available inside the ribbon’s INSERT > Tables tab group.

You can create a PivotTable in the SpreadJS Designer Component in the following ways:
Create a PivotTable from a selected data range.
Create a PivotTable from a Data Manager table or view.
Before using PivotTables in the Designer Component, make sure the PivotTable add-on is available in your application.
Purchase a valid PivotTable add-on license.
Note: PivotTable is a separate deployment add-on package in SpreadJS. To deploy this feature, you should have a valid SpreadJS license along with the PivotTable add-on license. For more information, please refer to SpreadJS Designer Component and PivotTable Add-on and SpreadJS Pricing and Licensing pages.
Use the SpreadJS Designer Component in your project with a new or existing spreadsheet by following the steps mentioned on the Quick Start page.
Add the following additional script file in your SpreadJS Designer Component application to use the PivotTable feature.
<script src="scripts/gc.spread.pivot.pivottables.x.x.x.min.js" type="text/javascript"></script>Run the application. You can now create PivotTables in the SpreadJS Designer Component.
Create a PivotTable from a Data Range
You can create a PivotTable by selecting a worksheet range as the data source.
Import or create the data source that you want to analyze.
Note:
Also supports full column as data source, for example '=Sheet!$A:$B', but does not support relative references.
Go to the INSERT tab and click on the PivotTable button.
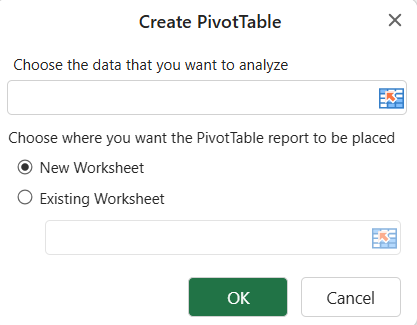
Select the data that you want to analyze using a pivot table and select either New Worksheet or Existing Worksheet. In the case of Existing Worksheet, select the range where you want the pivot table to appear and click OK.
Click on the PivotTable area to work with the pivot table. This will open the pivot panel.
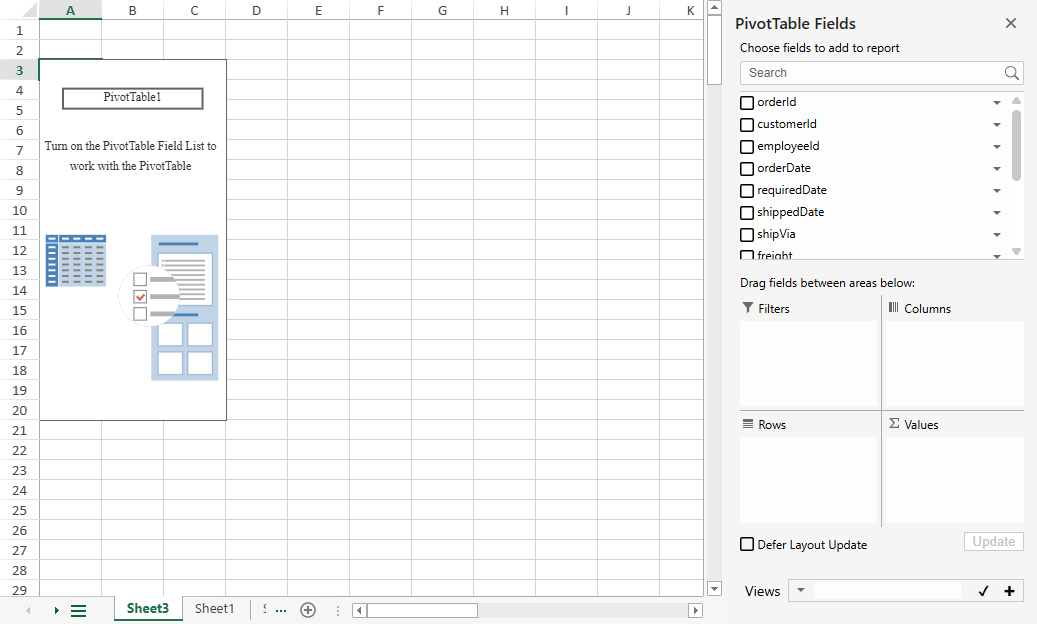
Use the pivot panel to add, remove, drag, and move fields in a pivot table as per your requirement. For more information, see Pivot Table.
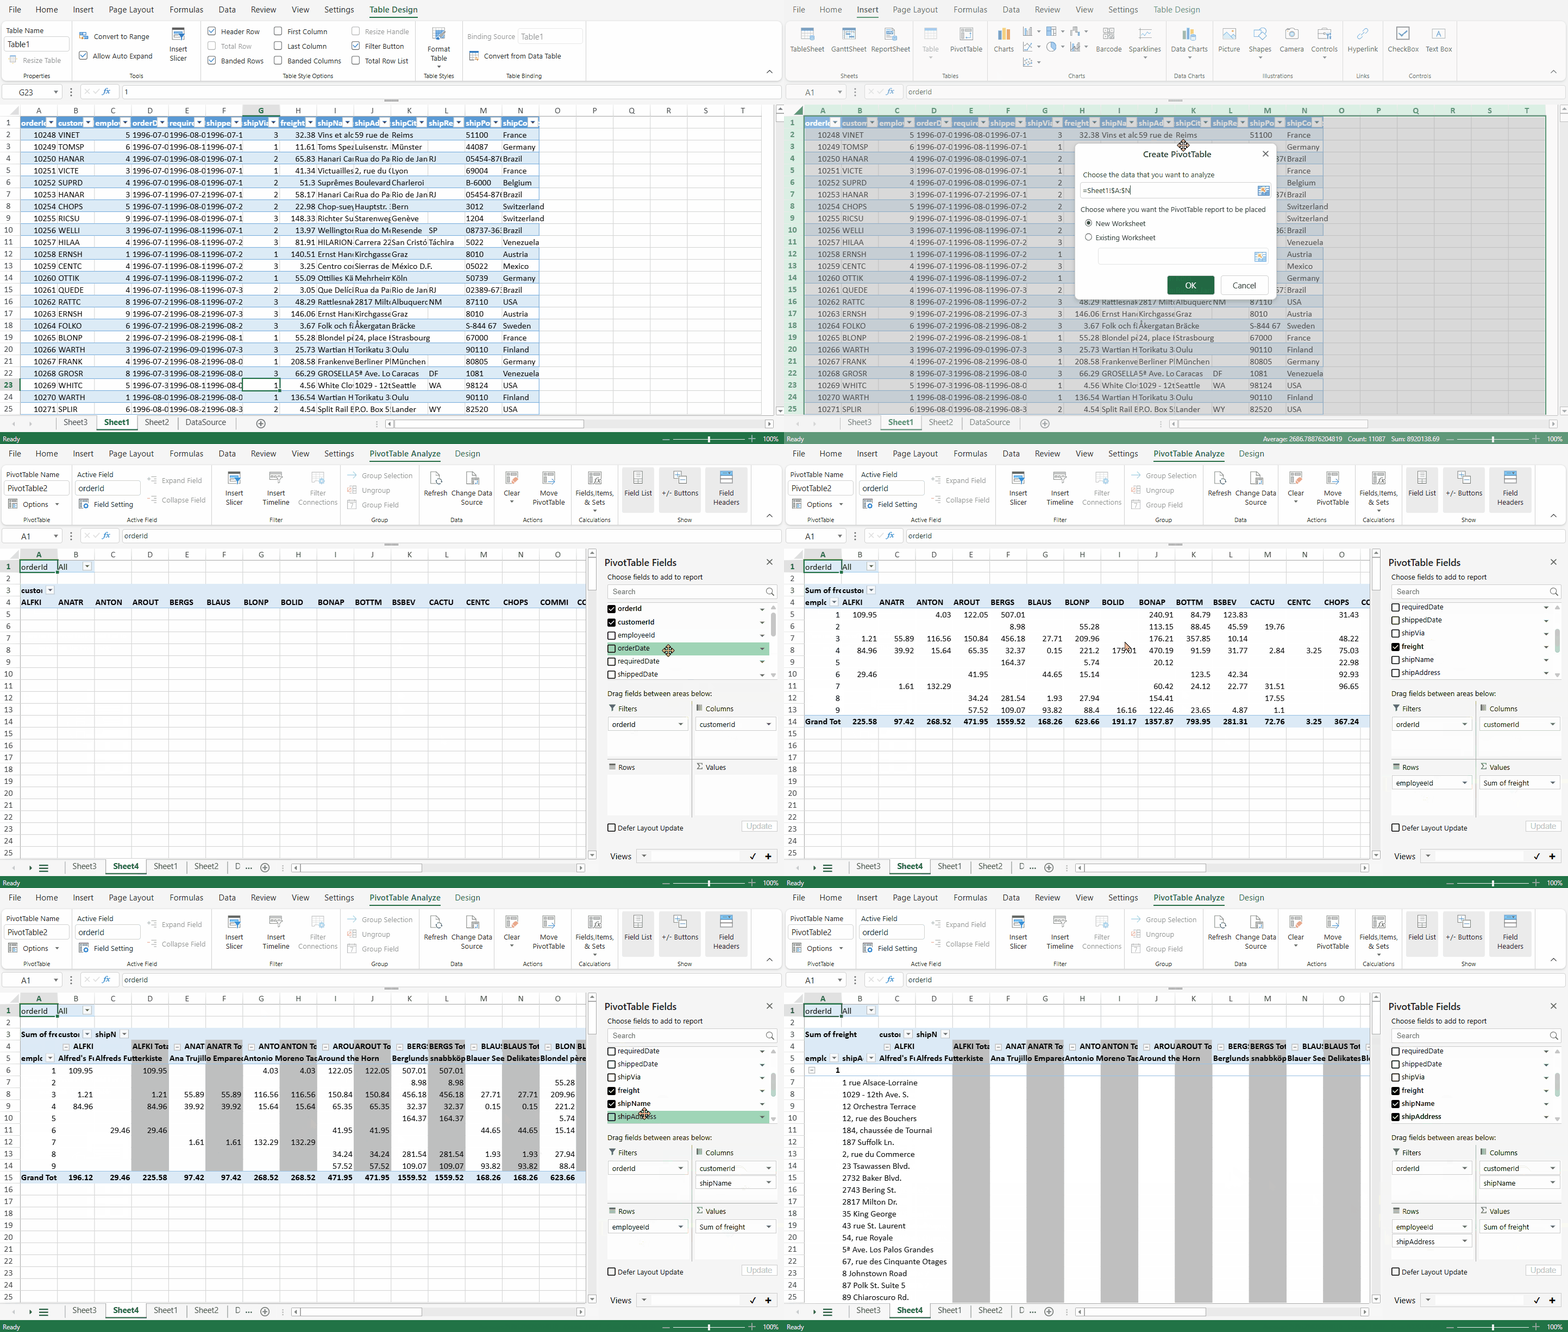
The following GIF illustrates the steps to create a pivot table.
Create a PivotTable from a Data Manager Table
You can also create a PivotTable directly from a Data Manager table or view.
Make sure that a Data Manager table or view is available in the Designer Component.
Go to the INSERT tab and open the PivotTable drop-down menu.
Select From Data Table.

If no Data Manager table is available, From Data Table is disabled.
In the Create PivotTable dialog, choose the data that you want to analyze.
You can select a source from the following fields:
Data Table: Select a Data Manager table.
Data View: Select a Data Manager view.
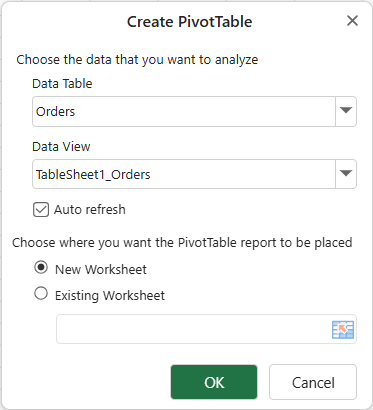
Optional: Select Auto refresh to refresh the PivotTable automatically when the source data changes.
Choose where you want the PivotTable report to be placed.
You can select either:
New Worksheet
Existing Worksheet
If you select Existing Worksheet, select the range where you want the PivotTable to appear.
Click OK.
Designer creates a new worksheet and inserts a PivotTable based on the selected Data Manager table or view.
Quickly Create a PivotTable from a Data Manager Table
When Data Manager tables are available, the From Data Table menu can also display the available tables.

To quickly create a PivotTable from a Data Manager table:
Go to the INSERT tab and open the PivotTable drop-down menu.
Point to From Data Table to display the available Data Manager tables.
Select a table from the list.
Designer creates a new worksheet and inserts a PivotTable based on the selected Data Manager table.
This quick creation flow is available for Data Manager tables. To create a PivotTable from a Data Manager view or to configure the placement options, use the Create PivotTable dialog.