- SpreadJS Overview
- Getting Started
- JavaScript Frameworks
- Best Practices
-
Features
- Workbook
- Worksheet
- Rows and Columns
- Headers
- Cells
- Data Binding
- Data Manager
- TableSheet
- GanttSheet
- ReportSheet
- Data Charts
- JSON Schema with SpreadJS
- SpreadJS File Format
- Data Validation
- Conditional Formatting
- Sort
- Group
- Formulas
- What-If Analysis
- Serialization
- Keyboard Actions
- Shapes
- Floating Objects
- Barcodes
- Charts
- Sparklines
- Tables
- Pivot Table
- Slicer
- Theme
- User Management
- Culture
- AI Assistant
- SpreadJS Designer
- SpreadJS Designer VSCode Plugin
- Tutorials
- SpreadJS Designer Component
- SpreadJS Collaboration Server
- Touch Support
- Formula Reference
- Import and Export Reference
- Events
- API Documentation
- Release Notes
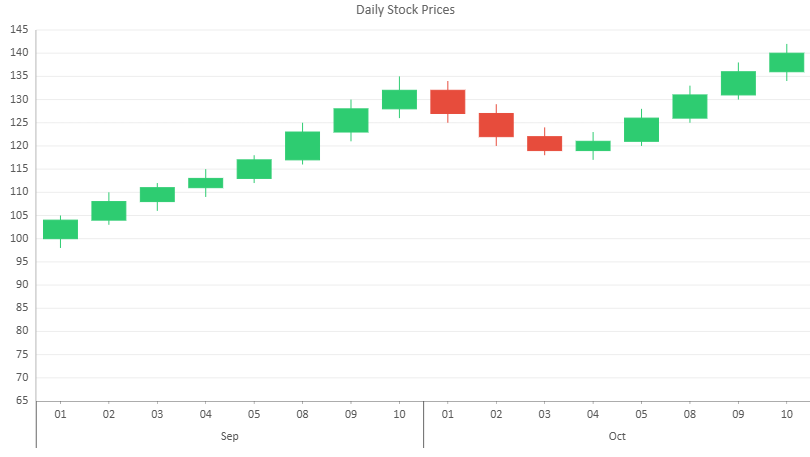
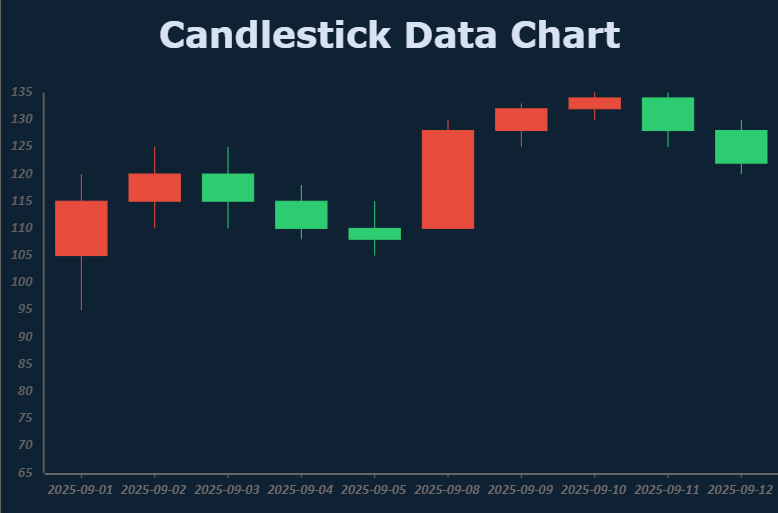
Candlestick Charts
A Candlestick chart displays price movement across trading intervals. Each candlestick represents a single category item and visualizes four values: open, high, low, and close.
This chart type is widely used in financial applications to analyze market direction, volatility, and short-term price behavior.
Value Configuration
A candlestick chart requires four numeric fields for each data point:
openhighlowclose
The recommended configuration is to bind these fields as a single value group using the vectors structure:
values: [{
  vectors: {
    open:  { field: "open" },
    high:  { field: "high" },
    low:   { field: "low" },
    close: { field: "close" }
  }
}]
Bind the fields in the logical order open → high → low → close to ensure correct interpretation.
Legacy configurations that bind these fields as separate value items remain supported.
Category Configuration
Candlestick charts support both flat and hierarchical category binding.
Example (hierarchical binding):
category: {
  field: "month",
  child: {
    field: "day"
  }
}
If only a single category field is provided, the chart uses a flat category axis.
Using Code
The following example creates a candlestick chart by binding OHLC fields and grouping the category axis by Month > Day.
const sheet = spread.getActiveSheet();
sheet.name("Candlestick Chart");
const dataManager = spread.dataManager();

function createStockTable(dataManager) {
    return dataManager.addTable("Stock", {
        data: [
            // September - uptrend
            { month: "Sep", day: "01", open: 100, high: 105, low: 98,  close: 104 },
            { month: "Sep", day: "02", open: 104, high: 110, low: 103, close: 108 },
            { month: "Sep", day: "03", open: 108, high: 112, low: 106, close: 111 },
            { month: "Sep", day: "04", open: 111, high: 115, low: 109, close: 113 },
            { month: "Sep", day: "05", open: 113, high: 118, low: 112, close: 117 },
            { month: "Sep", day: "08", open: 117, high: 125, low: 116, close: 123 },
            { month: "Sep", day: "09", open: 123, high: 130, low: 121, close: 128 },
            { month: "Sep", day: "10", open: 128, high: 135, low: 126, close: 132 },

            // October - pullback then recovery
            { month: "Oct", day: "01", open: 132, high: 134, low: 125, close: 127 },
            { month: "Oct", day: "02", open: 127, high: 129, low: 120, close: 122 },
            { month: "Oct", day: "03", open: 122, high: 124, low: 118, close: 119 },
            { month: "Oct", day: "04", open: 119, high: 123, low: 117, close: 121 },
            { month: "Oct", day: "05", open: 121, high: 128, low: 120, close: 126 },
            { month: "Oct", day: "08", open: 126, high: 133, low: 125, close: 131 },
            { month: "Oct", day: "09", open: 131, high: 138, low: 130, close: 136 },
            { month: "Oct", day: "10", open: 136, high: 142, low: 134, close: 140 }
        ]
    });
}

const stockTable = createStockTable(dataManager);
await stockTable.fetch();

const dataChart = sheet.dataCharts.add("candlestickChart", 10, 10, 700, 400);

dataChart.setChartConfig({
    tableName: "Stock",
    plots: [{
        type: GC.Spread.Sheets.DataCharts.DataChartType.candlestick,
        encodings: {
            values: [{
                vectors: {
                    open: { field: "open" },
                    high: { field: "high" },
                    low: { field: "low" },
                    close: { field: "close" }
                }
            }],
            category: {
                field: "month",
                child: {
                    field: "day"
                }
            }
        },
        config: {
            palette: ["#2ECC71", "#E74C3C"]
        }
    }],
    config: {
        header: {
            title: "Daily Stock Prices"
        }
    }
});