- SpreadJS Overview
- Getting Started
- JavaScript Frameworks
- Best Practices
-
Features
- Workbook
- Worksheet
- Rows and Columns
- Headers
- Cells
- Data Binding
- Data Manager
- TableSheet
- GanttSheet
- ReportSheet
- Data Charts
- JSON Schema with SpreadJS
- SpreadJS File Format
- Data Validation
- Conditional Formatting
- Sort
- Group
- Formulas
- What-If Analysis
- Serialization
- Keyboard Actions
- Shapes
- Floating Objects
- Barcodes
- Charts
- Sparklines
- Tables
- Pivot Table
- Slicer
- Theme
- User Management
- Culture
- AI Assistant
- SpreadJS Designer
- SpreadJS Designer VSCode Plugin
- Tutorials
- SpreadJS Designer Component
- SpreadJS Collaboration Server
- Touch Support
- Formula Reference
- Import and Export Reference
- Events
- API Documentation
- Release Notes
OHLC Charts
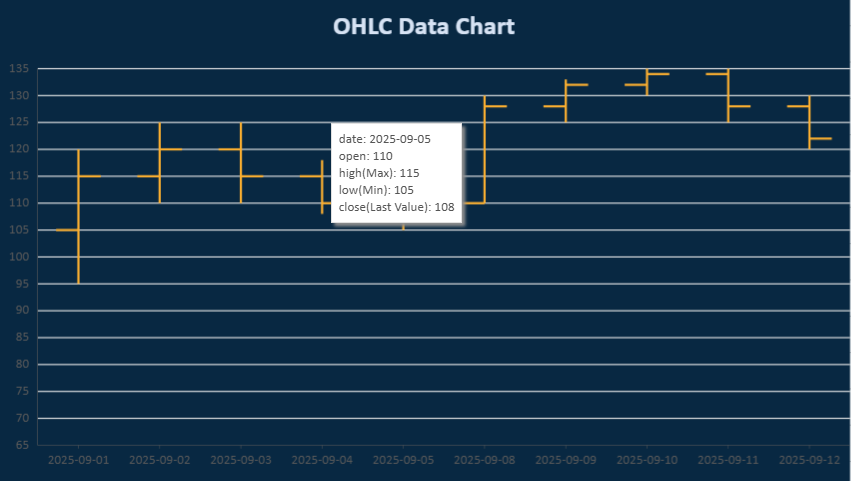
The OHLC chart is a financial chart used to display price movement over time. Each data point represents a trading interval and visualizes price values using tick marks rather than a filled body.
Compared to a candlestick chart, the OHLC chart provides a more compact representation of price behavior.
Value Configuration
An OHLC chart supports two input modes:
OHLC Mode
Requires four fields:
openhighlowclose
values: [{
  vectors: {
    open:  { field: "open" },
    high:  { field: "high" },
    low:   { field: "low" },
    close: { field: "close" }
  }
}]
HLC Mode
Requires three fields:
highlowclose
values: [{
  vectors: {
    high:  { field: "high" },
    low:   { field: "low" },
    close: { field: "close" }
  }
}]
Stock values should be bound directly and must not use aggregate functions.
Legacy configurations that bind these fields as separate value items remain supported.
Category Configuration
OHLC charts support both flat and hierarchical category binding.
Example:
category: {
  field: "month",
  child: {
    field: "day"
  }
}
If only a single category field is provided, the chart uses a flat category axis.
Using Code
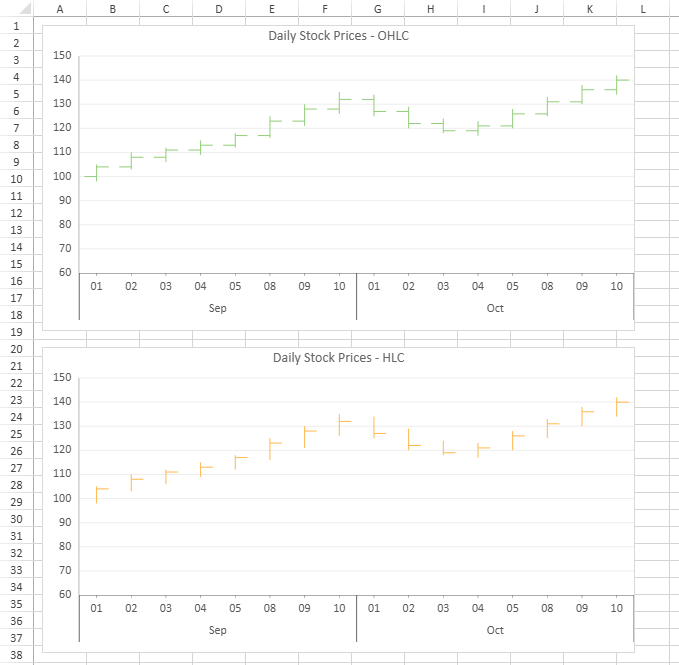
The following example creates two OHLC charts from the same data source. The first chart uses OHLC mode, and the second chart uses HLC mode. Both charts group the category axis by Month > Day.
const sheet = spread.getActiveSheet();
sheet.name("OHLC Chart");
const dataManager = spread.dataManager();

function createStockTable(dataManager) {
    return dataManager.addTable("Stock", {
        data: [
            // September - uptrend
            { month: "Sep", day: "01", open: 100, high: 105, low: 98,  close: 104 },
            { month: "Sep", day: "02", open: 104, high: 110, low: 103, close: 108 },
            { month: "Sep", day: "03", open: 108, high: 112, low: 106, close: 111 },
            { month: "Sep", day: "04", open: 111, high: 115, low: 109, close: 113 },
            { month: "Sep", day: "05", open: 113, high: 118, low: 112, close: 117 },
            { month: "Sep", day: "08", open: 117, high: 125, low: 116, close: 123 },
            { month: "Sep", day: "09", open: 123, high: 130, low: 121, close: 128 },
            { month: "Sep", day: "10", open: 128, high: 135, low: 126, close: 132 },

            // October - pullback then recovery
            { month: "Oct", day: "01", open: 132, high: 134, low: 125, close: 127 },
            { month: "Oct", day: "02", open: 127, high: 129, low: 120, close: 122 },
            { month: "Oct", day: "03", open: 122, high: 124, low: 118, close: 119 },
            { month: "Oct", day: "04", open: 119, high: 123, low: 117, close: 121 },
            { month: "Oct", day: "05", open: 121, high: 128, low: 120, close: 126 },
            { month: "Oct", day: "08", open: 126, high: 133, low: 125, close: 131 },
            { month: "Oct", day: "09", open: 131, high: 138, low: 130, close: 136 },
            { month: "Oct", day: "10", open: 136, high: 142, low: 134, close: 140 }
        ]
    });
}

const stockTable = createStockTable(dataManager);
await stockTable.fetch();

const dataChart1 = sheet.dataCharts.add("ohlcChart1", 10, 10, 700, 360);
const dataChart2 = sheet.dataCharts.add("ohlcChart2", 10, 390, 700, 360);

dataChart1.setChartConfig({
    tableName: "Stock",
    plots: [{
        type: GC.Spread.Sheets.DataCharts.DataChartType.ohlc,
        encodings: {
            values: [{
                vectors: {
                    open: { field: "open" },
                    high: { field: "high" },
                    low: { field: "low" },
                    close: { field: "close" }
                }
            }],
            category: {
                field: "month",
                child: {
                    field: "day"
                }
            }
        }
    }],
    config: {
        header: {
            title: "Daily Stock Prices - OHLC"
        }
    }
});

dataChart2.setChartConfig({
    tableName: "Stock",
    plots: [{
        type: GC.Spread.Sheets.DataCharts.DataChartType.ohlc,
        encodings: {
            values: [{
                vectors: {
                    high: { field: "high" },
                    low: { field: "low" },
                    close: { field: "close" }
                }
            }],
            category: {
                field: "month",
                child: {
                    field: "day"
                }
            }
        },
        config: {
            palette: ["#FFB74D"]
        }
    }],
    config: {
        header: {
            title: "Daily Stock Prices - HLC"
        }
    }
});