Version 1
Customizing the Hierarchy Footer
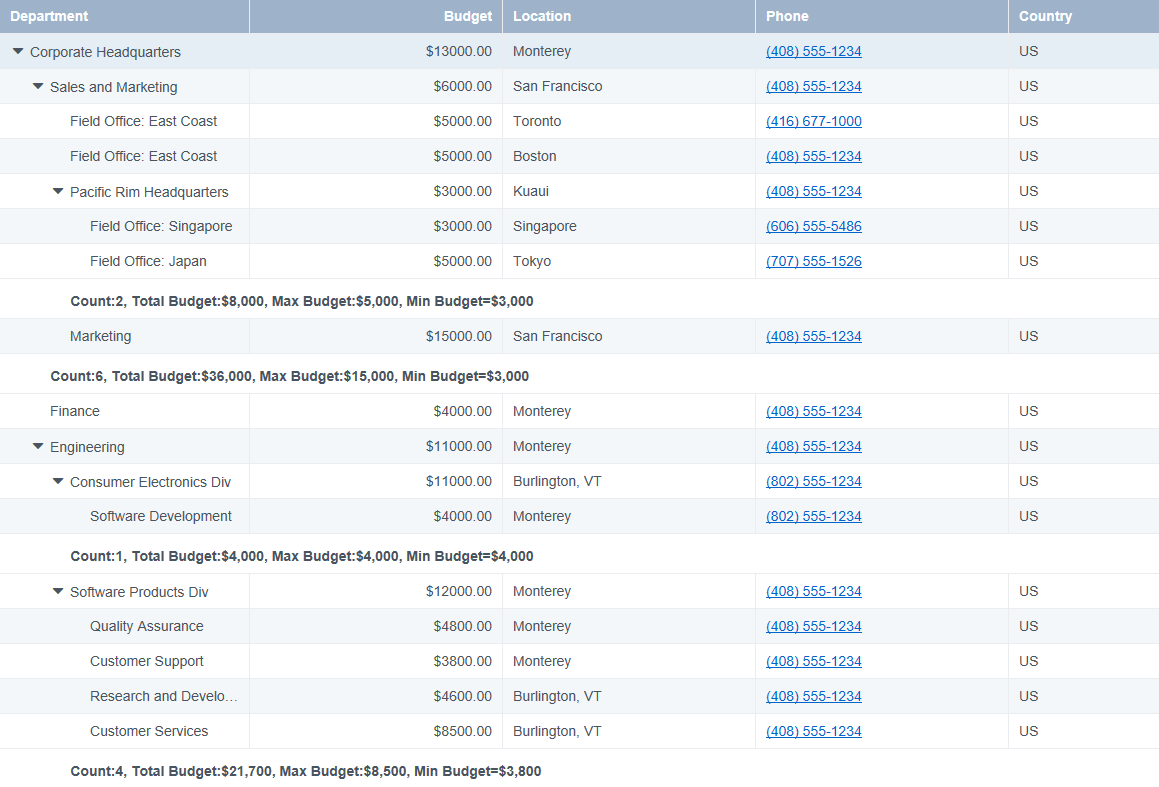
DataViewsJS allows you to customize the hierarchy footers. You can display information such as aggregates, totals, summaries, and so on.
Use the following steps to customize the hierarchy footer.

Sample Code
These steps assume that you have already initialized the grid and defined the columns. See Creating a Basic Grid and Defining Columns for additional information.
While initializing the code by calling the grid ID, use the template property in the footer property. The footer property is available in the hierarchy property. The template property contains formatting and the formulas necessary to display the aggregates.
var dataView = new GC.DataViews.DataView(
  document.getElementById('grid1'),
  data,
  columns,
  new GC.DataViews.GridLayout({
    allowSorting: true,
    showRowHeader: false,
    hierarchy: {
      keyField: 'id',
      parentField: 'parent',
      collapsed: false,
      column: 'department',
      footer: {
        visible: true,
        height: 40,
        template:
          '<p class="footer-p">Count:\{{=it.eval("=COUNT([id])")}}, Total Budget:\{{=it.eval("=SUM([budget]", "$#,#")}}, Max Budget:\{{=it.eval("=MAX([budget]", "$#,#")}}, Min Budget=\{{=it.eval("=MIN([budget]", "$#,#")}}</p>',
      },
    },
  })
);
See also
Feedback
Submit and view feedback for


