
- Getting Started
- Developer Guides
-
Report Author Guides
- Quick Start
- Report Designer Interface
- Report Viewer Interface
- Data Binding
- Report Configuration
- Report Themes
- Report Stylesheets
- Report Layers
- Report Parameters
- Interactive Reports
-
Report Items
- Common Properties
-
Data Regions
- Table
- Banded List
- List
- Tablix
-
Chart
- Plot
- Axes
- Legend
- Overlays
- Sparkline
- Bullet Chart
- Data Visualizers
- Supplemental report items
- Expressions
- Report Parts
- Master Reports
- Tutorials
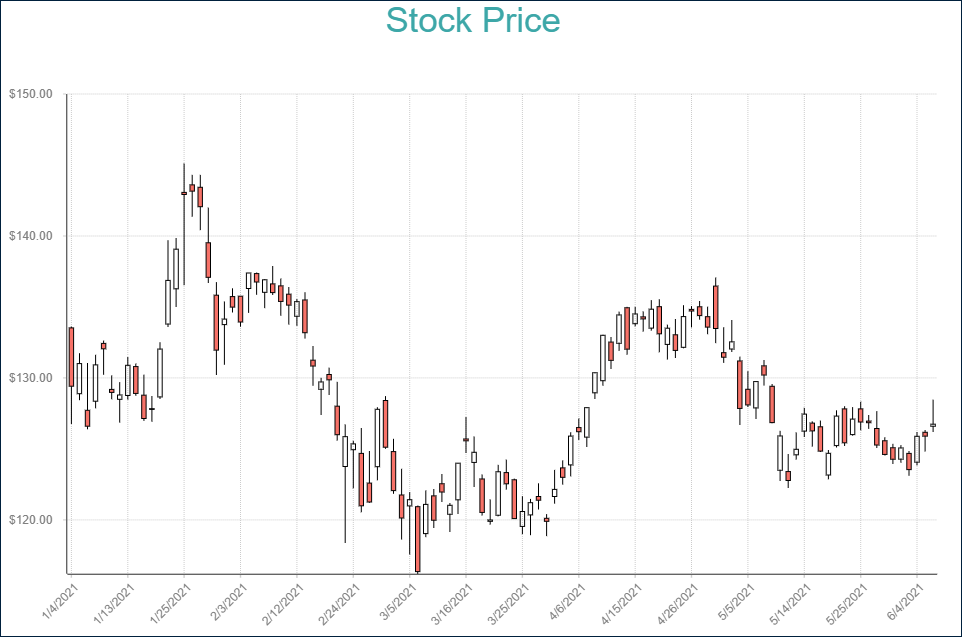
Candlestick, High-Low-Close, and High-Low-Open-Close Plots
The Candlestick, High-Low-Close, and High-Low-Open-Close plots are suitable to show price movements of a currency or other assets over time. These plots arrange time along the horizontal axis and encode data values into shapes representing the high, low, open, and close prices.
Candlestick
A Candlestick plot encodes price points using rectangles that indicate the open and the close values. If the open value is greater than the close value, then the rectangle is filled with the background color. The high and low values are shown by vertical lines projecting from the top and bottom of a rectangle. For instance, the Candlestick Demo shows movement of the stock price for a virtual company.
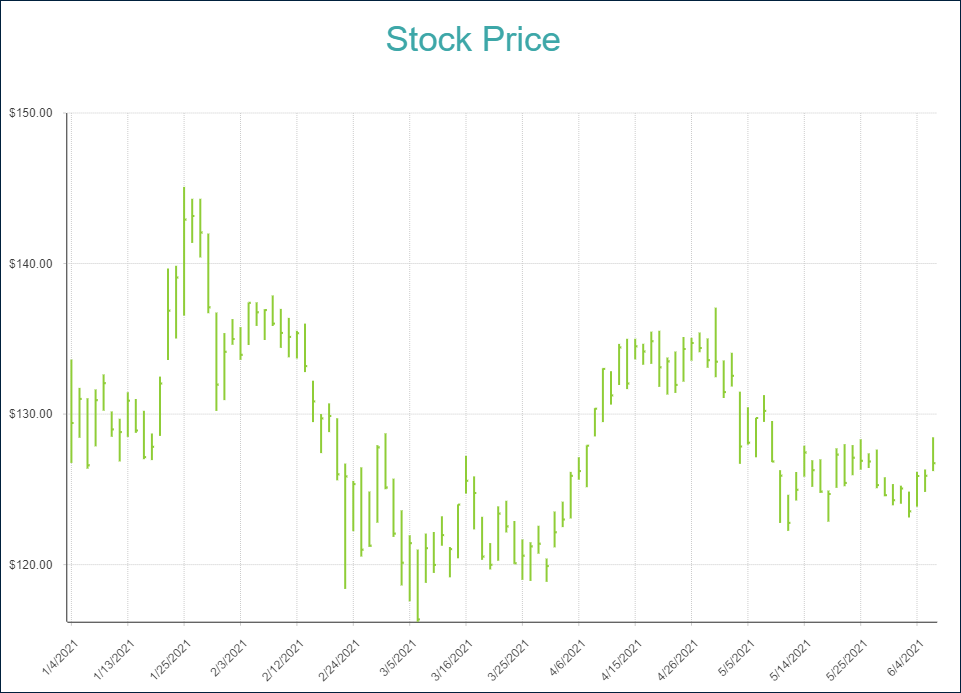
High-Low-Close
A High-Low-Close plot encodes price points using lines with a marker. The marker indicates the closing value. The upper and the lower ends of the line indicate the high and low values, respectively. For instance, the High-Low-Close Demo shows movement of stock price for a virtual company.
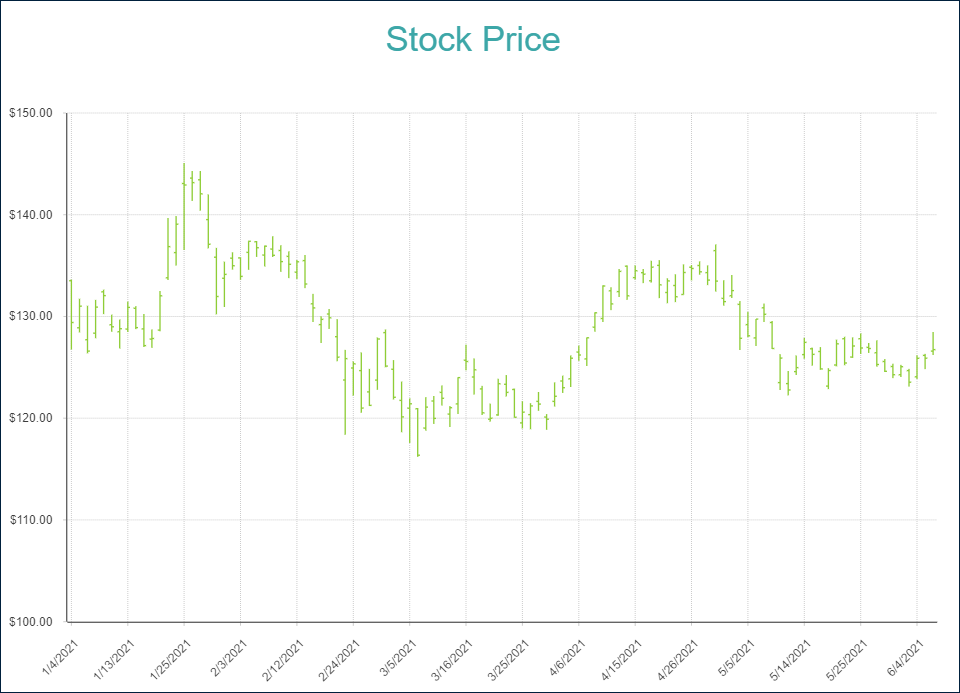
High-Low-Open-Close
A High-Low-Open-Close plot encodes price points using lines with two markers. The marker on the left side of a line indicates the open value, the marker on the right side - close value. The upper and the lower ends of the line indicate the high and low values, respectively. For instance, the High-Low-Open-Close Demo shows movement of the stock price for a virtual company.
You can use the following demos to explore plot properties - open a link, toggle the Report explorer, select the Plot - Plot 1 node and use the Properties panel to modify the configuration.
You could also download the report files listed below and open them in the Standalone Report Designer.