
- Getting Started
- Developer Guides
-
Report Author Guides
- Quick Start
- Report Designer Interface
- Report Viewer Interface
- Data Binding
- Report Configuration
- Report Themes
- Report Stylesheets
- Report Layers
- Report Parameters
- Interactive Reports
-
Report Items
- Common Properties
-
Data Regions
- Table
- Banded List
- List
- Tablix
-
Chart
- Plot
- Axes
- Legend
- Overlays
- Sparkline
- Bullet Chart
- Data Visualizers
- Supplemental report items
- Expressions
- Report Parts
- Master Reports
- Tutorials
Creating Candlestick, High-Low-Close, and High-Low-Open-Close Plots
Introduction
Before creating and configuring Candlestick, High-Low-Close (HLC), and Open-High-Low-Close (OHLC) Plots, ensure that a chart has been added to your report.For instructions on adding a chart and launching the Chart Wizard, see Adding a Chart.Once the Chart Wizard is open, select the Candlestick, High-Low-Close, or Open-High-Low-Close plot type, choose the dataset to visualize, and proceed to the next page.
Plot Settings
The Settings page of the Chart Wizard for Candlestick, High-Low-Close, and Open-High-Low-Close plots is structured as shown below: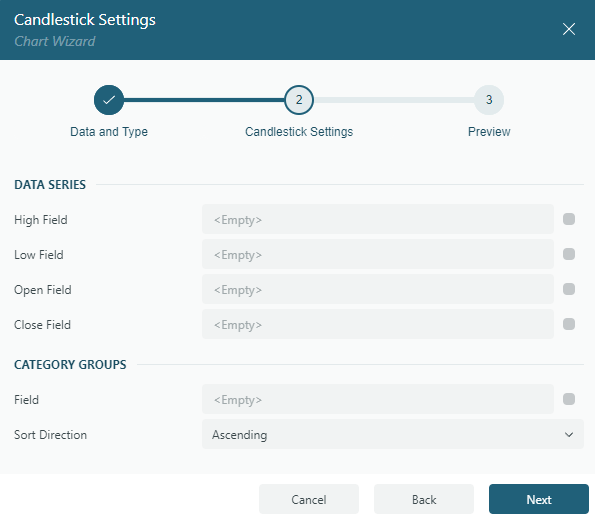
Data Series
The Fields collection defines the Data Values used in financial charts. These values determine the following visual properties:
High Field – Represents the highest price reached during the trading period, defining the top of the wick (shadow).
Low Field – Represents the lowest price reached during the trading period, defining the bottom of the wick (shadow).
Open Field (Candlestick and OHLC plots only) – Represents the opening price of the trading period. In Candlestick plots, it defines the top or bottom of the body, depending on whether the price increased or decreased.
Close Field – Represents the closing price of the trading period. In Candlestick plots, it defines the top or bottom of the body, opposite the Open price.
In High-Low-Close (HLC) plots, only the High, Low, and Close fields are used. In Open-High-Low-Close (OHLC) and Candlestick plots, all four fields are required.
Series Groups
Field: Select the field, or specify an expression, that defines subgroups within the chart. In financial plots, this can be used to compare multiple stocks, commodities, or financial instruments within the same plot. Each unique value in this field represents a separate series, allowing for direct visual comparisons.
Sort Direction: Specify whether series groups are sorted in Ascending or Descending order based on the selected field.
Once you have configured the Data Values and Series Groups, click Next to proceed to the Preview and Final Adjustments page to complete the chart creation.