
- Getting Started
- Developer Guides
-
Report Author Guides
- Quick Start
- Report Designer Interface
- Report Viewer Interface
- Data Binding
- Report Configuration
- Report Themes
- Report Stylesheets
- Report Layers
- Report Parameters
- Interactive Reports
-
Report Items
- Common Properties
-
Data Regions
- Table
- Banded List
- List
- Tablix
-
Chart
- Plot
- Axes
- Legend
- Overlays
- Sparkline
- Bullet Chart
- Data Visualizers
- Supplemental report items
- Expressions
- Report Parts
- Master Reports
- Tutorials
Scatter and Bubble Plots (Standard & Radar)
Overview
Scatter, Bubble, Radar Scatter, and Radar Bubble plots are effective for visualizing relationships between Data Values, showing how two or more variables correlate. These plots differ in how they arrange and represent data:
Scatter Plots position Symbols based on two numerical values—one on the horizontal axis and one on the vertical axis.
Bubble Plots extend Scatter Plots by encoding an additional data value into the size of each symbol, allowing visualization of three variables simultaneously.
Radar Scatter Plots arrange Categories radially around a circle, positioning Symbols along radial lines to display ordinal measurements of one or two variables across multiple categories. Points can be connected with straight lines to emphasize relationships.
Radar Bubble Plots extend Radar Scatter Plots by encoding an additional data value into the size of each symbol, providing deeper insights into categorical data distributions.
These plot types are useful for identifying patterns, correlations, clusters, and outliers in datasets, making them ideal for scientific research, financial analysis, performance comparisons, and market segmentation.
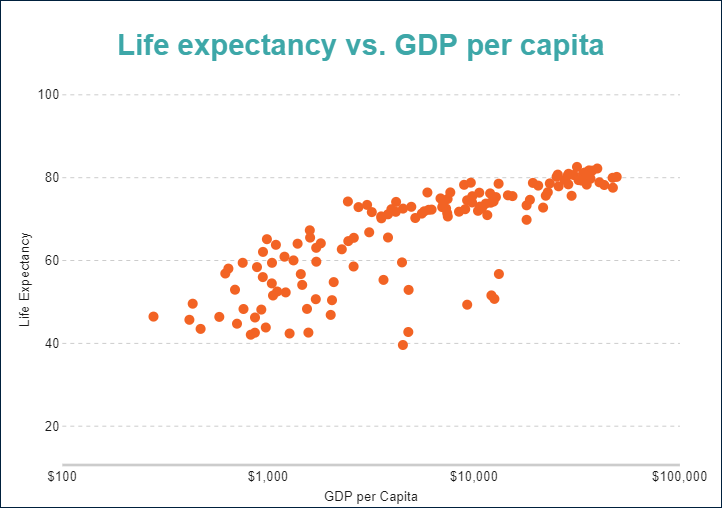
Simple Scatter Plot
A Scatter Plot is used to visualize relationships between two numerical variables, helping to identify correlations, patterns, and trends in data.For example, the Simple Scatter Demo illustrates the correlation between GDP per capita and life expectancy, showing how economic wealth is associated with longer lifespans.
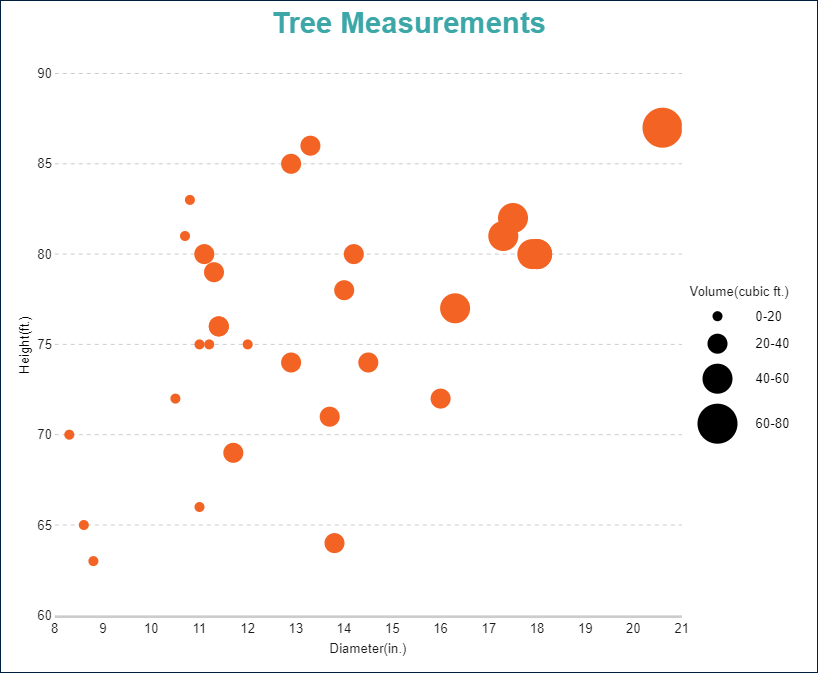
Simple Bubble Plot
A Bubble Plot extends a Scatter Plot by incorporating a third variable, which is represented by the size of the symbols. This allows for a more detailed analysis of relationships between multiple data points.For example, the Simple Bubble Demo visualizes the correlation between a tree’s diameter, height, and volume, where larger bubbles indicate greater tree volume.
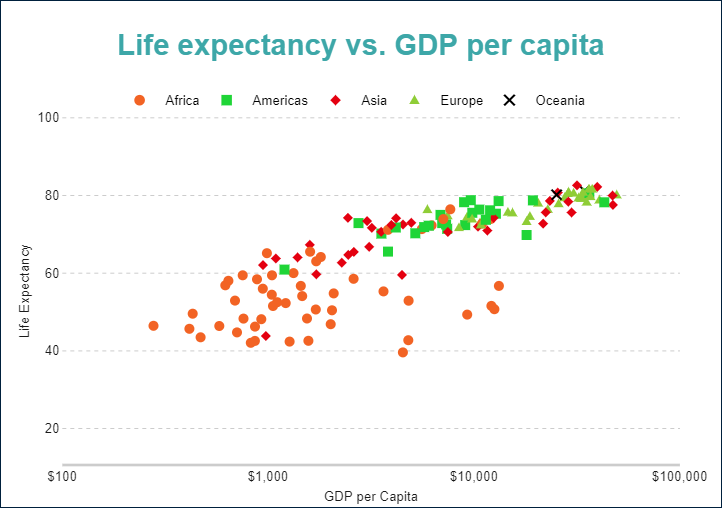
Multi-Category Scatter and Bubble Plots
Scatter and Bubble plots can be configured to categorize Data Values, using symbol colors, shapes, or both to distinguish between different groups. This allows for a more detailed comparison of relationships within subgroups.For example, the Multi-Category Scatter Demo visualizes the correlation between GDP per capita and life expectancy, categorizing data points by continent, with each region represented by a unique symbol and color.
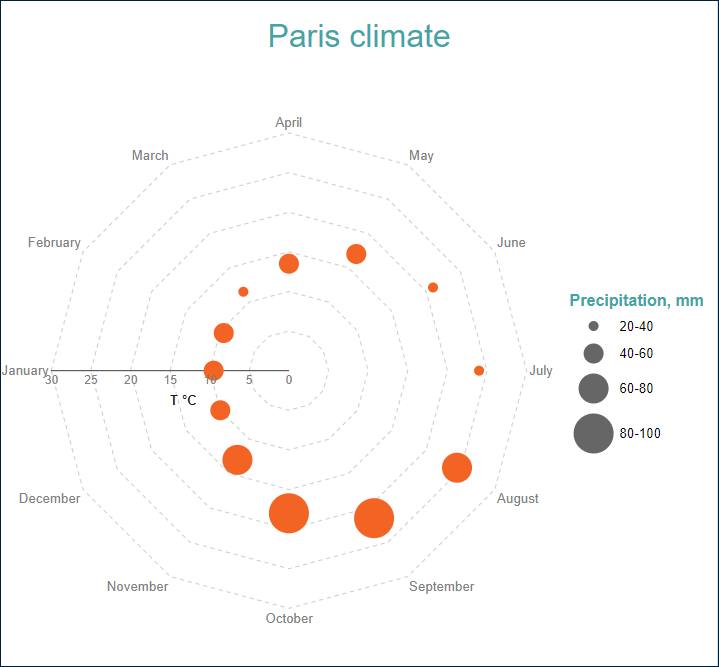
Simple Radar Scatter and Bubble Plots
A Radar Scatter Plot visualizes measurements of a single variable, positioning data points along radial lines extending from the center. A Radar Bubble Plot extends this concept by encoding an additional variable into the size of the data points, allowing for multi-dimensional comparisons. For example, the Simple Radar Bubble Demo represents average monthly temperature and precipitation in Paris, France.
Temperature is plotted along the radial lines, determining the position of each data point.
Precipitation is represented by the size of the data points, making it easy to compare rainfall amounts across months.
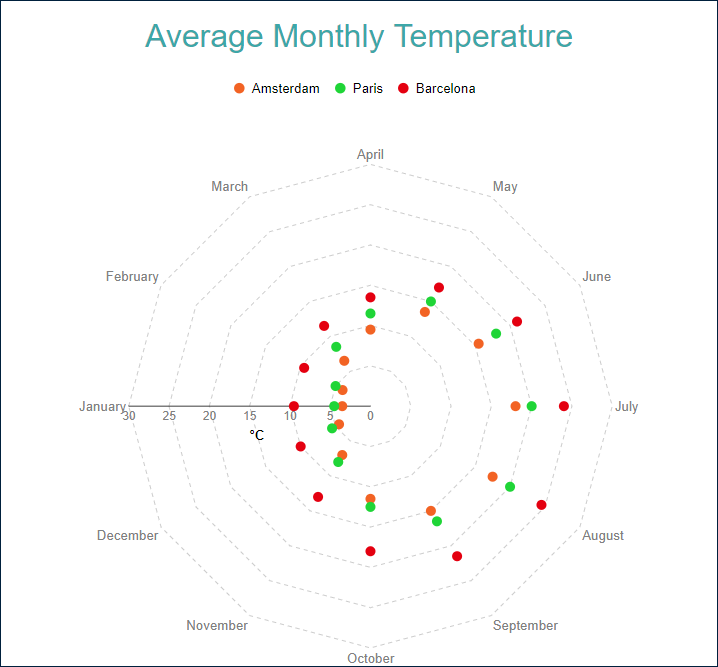
Multi-Category Radar Scatter and Bubble Plots
Radar Scatter and Bubble plots can be configured to categorize Data Values using symbol colors, shapes, or both, enabling comparisons across multiple subcategories. This approach helps distinguish different groups within the dataset while preserving the radial layout.For example, the Multi-Category Radar Scatter Demo visualizes average monthly temperatures in three European cities, with each city represented by a distinct symbol color, allowing for easy comparison of climate patterns throughout the year.
You can use the following demos to explore plot properties - open a link, toggle the Report explorer, select the Plot - Plot 1 node and use the Properties panel to modify the configuration.
You could also download the report files listed below and open them in the Standalone Report Designer.
Next Steps
For more detailed information about Line Plots, refer to the following pages: