
- Spread for WPF Overview
- About the Product
- Getting Started
- Quick Start
- Designer
- Features
- Assembly Reference
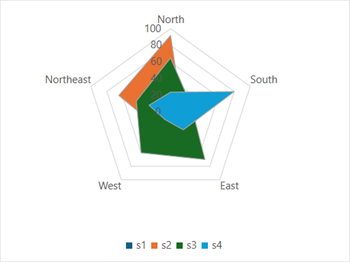
Radar Chart
Radar charts are radial charts that help in visualizing the comparison of two or more groups of values against various features or characteristics. These charts represent each variable on a separate axis which is arranged radially around a center at equal distances from each other. Each of these axes shares the same tick marks and scale. The data for each observation is plotted along this axis and then combined to form a polygon. Multiple observations, i.e., polygons plotted on a chart, are a great way to identify outliers between each variable.
Types of Radar Charts
Spread for WPF supports the following types of radar charts.
Sample Image | Description |
|---|---|
| Charts.ChartType.Radar Represents a radar chart. It used to represent multivariate data plotted in rows and columns in the graphical format. |
| ChartType.RadarFilled Represents a filled radar chart. It is used to display radar chart with areas highlighted by different colored regions for each value. |
| ChartType.RadarMarkers Represents a radar chart with markers. It is used to display radar chart with markers representing data for each value along with areas highlighted by different line colors. |


Using Code
Refer to the following example code to add a radar chart.
C#
// Radar chart.
object[,] dataArray = { { "", "North", "South", "East", "West", "Northeast" }, { "s1", 50, 25, 55, 30, 26 }, { "s2", 92, 14, 15, 24, 65 }, { "s3", 65, 26, 70, 60, 43 }, { "s4", 24, 80, 26, 11, 27 } };
for (int i = 0; i < dataArray.GetLength(0); i++)
{
     for (int j = 0; j < dataArray.GetLength(1); j++)
     {
      spreadSheet1.Workbook.ActiveSheet.Cells[i, j].Value = dataArray[i, j];
     }
}
spreadSheet1.Workbook.ActiveSheet.Cells["A1:F5"].Select();
spreadSheet1.Workbook.ActiveSheet.Shapes.AddChart(GrapeCity.Spreadsheet.Charts.ChartType.Radar, 100, 150, 400, 300, false);
VB
' Radar chart.
Dim dataArray = {
            {"", "North", "South", "East", "West", "Northeast"},
            {"s1", 50, 25, 55, 30, 26},
            {"s2", 92, 14, 15, 24, 65},
            {"s3", 65, 26, 70, 60, 43},
            {"s4", 24, 80, 26, 11, 27}}
For i = 0 To dataArray.GetLength(0) - 1
        For j = 0 To dataArray.GetLength(1) - 1
            spreadSheet1.Workbook.ActiveSheet.Cells(i, j).Value = dataArray(i, j)
        Next
Next
spreadSheet1.Workbook.ActiveSheet.Cells("A1:F5").Select()
spreadSheet1.Workbook.ActiveSheet.Shapes.AddChart(GrapeCity.Spreadsheet.Charts.ChartType.Radar, 100, 150, 400, 300, False)