
- Document Solutions for Excel Java Overview
- Key Features
- Getting Started
- Features
- Templates
-
Formula Reference
- Add-in and Automation Functions
- Compatibility Functions
- Database Functions
- Date and Time Functions
- Engineering Functions
- Financial Functions
- Information Functions
- Logical Functions
- Lookup and Reference Functions
- Math and Trigonometry Functions
-
Statistical Functions
- AVEDEV
- AVERAGE
- AVERAGEA
- AVERAGEIF
- AVERAGEIFS
- BETA.DIST
- BETA.INV
- BINOM.DIST
- BINOM.DIST.RANGE
- BINOM.INV
- CHISQ.DIST
- CHISQ.DIST.RT
- CHISQ.INV
- CHISQ.INV.RT
- CHISQ.TEST
- CONFIDENCE.NORM
- CONFIDENCE.T
- CORREL
- COUNT
- COUNTA
- COUNTBLANK
- COUNTIF
- COUNTIFS
- COVARIANCE.P
- COVARIANCE.S
- DEVSQ
- EXPON.DIST
- F.DIST
- F.DIST.RT
- F.INV
- F.INV.RT
- F.TEST
- FISHER
- FISHERINV
- FORECAST
- FORECAST.LINEAR
- FREQUENCY
- GAMMA
- GAMMA.DIST
- GAMMA.INV
- GAMMALN
- GAMMALN.PRECISE
- GAUSS
- GEOMEAN
- GROWTH
- HARMEAN
- HYPGEOM.DIST
- INTERCEPT
- KURT
- LARGE
- LINEST
- LOGEST
- LOGNORM.DIST
- LOGNORM.INV
- MAX
- MAXA
- MAXIFS
- MEDIAN
- MIN
- MINA
- MINIFS
- MODE.MULT
- MODE.SNGL
- NEGBINOM.DIST
- NORM.DIST
- NORM.S.DIST
- NORM.S.INV
- NORMINV
- PEARSON
- PERCENTILE.EXC
- PERCENTILE.INC
- PERCENTRANK.EXC
- PERCENTRANK.INC
- PERMUT
- PERMUTATIONA
- PHI
- POISSON.DIST
- PROB
- QUARTILE.EXC
- QUARTILE.INC
- RANK.AVG
- RANK.EQ
- RSQ
- SKEW
- SKEW.P
- SLOPE
- SMALL
- STANDARDIZE
- STDEV.P
- STDEV.S
- STDEVA
- STDEVPA
- STEYX
- T.DIST
- T.DIST.2T
- T.DIST.RT
- T.INV
- T.INV.2T
- T.TEST
- TREND
- TRIMMEAN
- VAR.P
- VAR.S
- VARA
- VARPA
- WEIBULL.DIST
- Z.TEST
- Text Functions
- Web Functions
- File Operations
- Tutorials
- Use JDK 8 Date Time API
- Document Solutions Data Viewer
- API Reference
- Release Notes
COVARIANCE.P
This function returns the population covariance, which is the average of the products of deviations for each data point pair in two sets of numbers.
Syntax
COVARIANCE.P(array1, array2)
Arguments
This function has these arguments:
Argument | Description |
|---|---|
array1 | [Required] The first cell range of integers |
array2 | [Required] The second cell range of integers |
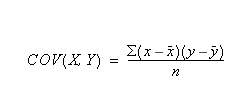
Remarks
Use this covariance function to determine the relationship between two sets of data. For example, you can determine whether greater income accompanies greater levels of education in a population.
The covariance is calculated as follows, where n and y are the sample means, AVERAGE(array1) and AVERAGE(array2), and n is the sample size.
Examples
COVARIANCE.P(J2:J5,L2:L5)
COVARIANCE.P(R2C12:R15C12,R2C14:R15C14)
COVARIANCE.P({7,5,6},{7,4,4}) gives the result 1
COVARIANCE.P({5,10,15,20,25},{4,8,16,32,64}) gives the result 144