
- Spread for WPF Overview
- Key Features
- Getting Started
- Quick Start
- Designer
- Features
- Assembly Reference
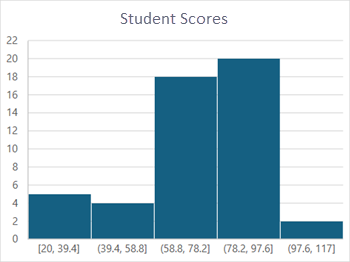
Histogram Chart
Histogram charts are visual representation of data distribution over a continuous interval or a certain period. These charts consist of vertical bars that indicate the frequency in each interval or bin, created by dividing the raw data values into a series of consecutive and non-overlapping intervals. A histogram looks more similar to the bar charts, but there are no gaps between bars.
Sample Image | Description |
|---|---|
| ChartType.Histogram Represents a Histogram chart. It is used to show the distribution of data grouped into bins. |
Using Code
Refer to the following example code to add a histogram chart.
C#
// Histogram chart.
object[,] dataArray ={
            {"John Mathew", 71, 74, 97, 85},
            {"Jim Parker", 76, 58, 88, 84},
            {"Sophia Ran", 97, 80, 74, 80},
            {"Wendi Blake", 55, 97, 84, 60},
            {"Stephan Lai", 81, 83, 94, 90},
            {"Fay Van Damme", 71, 78, 72, 82},
            {"Brevin Dice", 84, 80, 83, 93},
            {"Regina Oleveria", 86, 76, 56, 92},
            {"Georgi Facello", 78, 61, 91, 68},
            {"Bezalel Simmel", 85, 58, 92, 68},
            {"Sachin Tsukuda", 76, 70, 55, 81},
            {"Patricia Breugel", 64, 77, 83, 85},
            {"Zito Baaz", 82, 97, 66, 90},
            {"Navin Argence", 59, 87, 83, 85},
            {"Siamak Salverda", 77, 85, 97, 65},
            {"Khaled Kohling", 87, 67, 77, 97},
            {"Bangqing Kleiser", 49, 97, 78, 75},
            {"Rimli Dusink", 25, 61, 91, 91},
            {"Nathan Ranta", 65, 60, 96, 92},
            {"Gila Lukaszewicz", 27, 91, 62, 93},
            {"Kaijung Rodham", 31, 81, 67, 87},
            {"Mohammed Pleszkun", 20, 98, 67, 82},
            {"Shuichi Piazza", 67, 56, 81, 82},
            {"Katsuo Leuchs", 83, 74, 51, 42},
            {"Masanao Ducloy", 67, 64, 58, 73},
            {"Mihalis Crabtree", 80, 91, 57, 84},
            {"Danny Lenart", 92, 38, 99, 86},
            {"Yongqiao Dalton", 85, 61, 73, 81},
            {"Gaetan Veldwijk", 64, 52, 76, 72},
            {"Leszek Pulkowski", 95, 75, 64, 99},
            {"Weidon Gente", 77, 88, 77, 96},
            {"Krister Stranks", 72, 38, 89, 55},
            {"Ziyad Baaz", 89, 81, 83, 48},
            {"Ymte Perelgut", 67, 70, 97, 94},
            {"Tonia Butner", 99, 71, 87, 76},
            {"Shigeaki Narlikar", 78, 80, 80, 97},
            {"Ayakannu Beerel", 86, 61, 85, 81},
            {"Moni Bale", 60, 72, 71, 86},
            {"Manohar Heemskerk", 97, 60, 75, 78},
            {"Angus Swan", 33, 97, 99, 99},
            {"Christ Murtagh", 91, 76, 73, 80},
            {"Hilary Rodiger", 75, 64, 84, 54},
            {"Maren Baez", 45, 77, 86, 88},
            {"Greger Jahnichen", 98, 89, 81, 63},
            {"Ymte Duclos", 95, 83, 72, 72},
            {"Chenyi Hainaut", 81, 97, 99, 87},
            {"Kasidit Picel", 87, 80, 88, 80},
            {"Elrique Walstra", 96, 54, 38, 54},
            {"Adel Reghbati", 56, 88, 81, 88}
                    };
for (int i = 0; i < dataArray.GetLength(0); i++)
     for (int j = 0; j < dataArray.GetLength(1); j++)
          spreadSheet1.Workbook.ActiveSheet.Cells[i, j].Value = dataArray[i, j];
spreadSheet1.Workbook.ActiveSheet.Cells["A1:E49"].Select();
spreadSheet1.Workbook.ActiveSheet.Shapes.AddChart(GrapeCity.Spreadsheet.Charts.ChartType.Histogram, 100, 150, 400, 300, true);
VB
' Histogram chart.
Dim dataArray = {
                {"John Mathew", 71, 74, 97, 85},
                {"Jim Parker", 76, 58, 88, 84},
                {"Sophia Ran", 97, 80, 74, 80},
                {"Wendi Blake", 55, 97, 84, 60},
                {"Stephan Lai", 81, 83, 94, 90},
                {"Fay Van Damme", 71, 78, 72, 82},
                {"Brevin Dice", 84, 80, 83, 93},
                {"Regina Oleveria", 86, 76, 56, 92},
                {"Georgi Facello", 78, 61, 91, 68},
                {"Bezalel Simmel", 85, 58, 92, 68},
                {"Sachin Tsukuda", 76, 70, 55, 81},
                {"Patricia Breugel", 64, 77, 83, 85},
                {"Zito Baaz", 82, 97, 66, 90},
                {"Navin Argence", 59, 87, 83, 85},
                {"Siamak Salverda", 77, 85, 97, 65},
                {"Khaled Kohling", 87, 67, 77, 97},
                {"Bangqing Kleiser", 49, 97, 78, 75},
                {"Rimli Dusink", 25, 61, 91, 91},
                {"Nathan Ranta", 65, 60, 96, 92},
                {"Gila Lukaszewicz", 27, 91, 62, 93},
                {"Kaijung Rodham", 31, 81, 67, 87},
                {"Mohammed Pleszkun", 20, 98, 67, 82},
                {"Shuichi Piazza", 67, 56, 81, 82},
                {"Katsuo Leuchs", 83, 74, 51, 42},
                {"Masanao Ducloy", 67, 64, 58, 73},
                {"Mihalis Crabtree", 80, 91, 57, 84},
                {"Danny Lenart", 92, 38, 99, 86},
                {"Yongqiao Dalton", 85, 61, 73, 81},
                {"Gaetan Veldwijk", 64, 52, 76, 72},
                {"Leszek Pulkowski", 95, 75, 64, 99},
                {"Weidon Gente", 77, 88, 77, 96},
                {"Krister Stranks", 72, 38, 89, 55},
                {"Ziyad Baaz", 89, 81, 83, 48},
                {"Ymte Perelgut", 67, 70, 97, 94},
                {"Tonia Butner", 99, 71, 87, 76},
                {"Shigeaki Narlikar", 78, 80, 80, 97},
                {"Ayakannu Beerel", 86, 61, 85, 81},
                {"Moni Bale", 60, 72, 71, 86},
                {"Manohar Heemskerk", 97, 60, 75, 78},
                {"Angus Swan", 33, 97, 99, 99},
                {"Christ Murtagh", 91, 76, 73, 80},
                {"Hilary Rodiger", 75, 64, 84, 54},
                {"Maren Baez", 45, 77, 86, 88},
                {"Greger Jahnichen", 98, 89, 81, 63},
                {"Ymte Duclos", 95, 83, 72, 72},
                {"Chenyi Hainaut", 81, 97, 99, 87},
                {"Kasidit Picel", 87, 80, 88, 80},
                {"Elrique Walstra", 96, 54, 38, 54},
                                    {"Adel Reghbati", 56, 88, 81, 88}}
For i = 0 To dataArray.GetLength(0) - 1
        For j = 0 To dataArray.GetLength(1) - 1
            spreadSheet1.Workbook.ActiveSheet.Cells(i, j).Value = dataArray(i, j)
        Next
Next
spreadSheet1.Workbook.ActiveSheet.Cells("A1:E49").[Select](/spreadnet/docs/latest/online-wpf/spreadwpffeatures/charts/chart-types/statistical-charts/histogram-chart)
spreadSheet1.Workbook.ActiveSheet.Shapes.AddChart(GrapeCity.Spreadsheet.Charts.ChartType.Histogram, 100, 150, 400, 300, True)