
- Spread for WPF Overview
- About the Product
- Getting Started
- Quick Start
- Designer
- Features
- Assembly Reference
Bubble Chart
Bubble charts are particularly useful for financial data analysis. It displays the variations of a scatter chart where data points are replaced with bubbles and a third dimension is represented (Z axis) in the shape of the bubbles. This chart plots the z(size) values as well as the x and y values. Usually, this chart can be used when you want to plot three data series. The size of the bubbles is determined by the values in the third data series.
Types of Bubble Charts
Spread for WPF supports the following types of bubble charts.
Sample Image | Description |
|---|---|
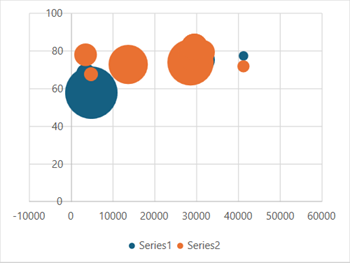
| ChartType.Bubble Represents a bubble chart. It is used to show relationships between sets of values. |
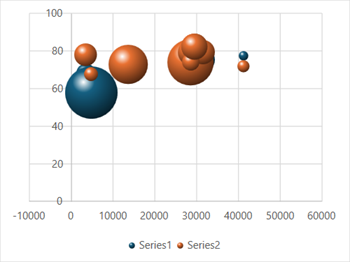
| ChartType.Bubble3DEffect Represents a 3D bubble chart. It is used to present the relationships between sets of values with 3D effects. |
Using Code
Refer to the following example code to add a bubble chart.
C#
// Bubble chart.
object[,] dataArray = {
     {28604, 77, 176869, 74, 6709669},
      {41163, 77.4, 276640, 71.8, 476640},
      {3516, 68, 1154657, 78, 1646773},
      {13670, 74.7, 102082, 72.7, 4952082},
      {28599, 75, 4986705, 79, 1986705},
      {29476, 77.1, 1943299, 82.1, 2243299},
      {31476, 75.4, 1958237, 79.4, 1858237},
      {28666, 78.1, 254830, 74.1, 954830},
      {4777, 57.7, 8706076, 67.7, 601776},
      {29550, 79.1, 1229285, 82.1, 2249285}
};
for (int i = 0; i < dataArray.GetLength(0); i++)
{
     for (int j = 0; j < dataArray.GetLength(1); j++)
     {
         spreadSheet1.Workbook.ActiveSheet.Cells[i, j].Value = dataArray[i, j];
     }
}
spreadSheet1.Workbook.ActiveSheet.Cells["A1:E10"].Select();
spreadSheet1.Workbook.ActiveSheet.Shapes.AddChart(GrapeCity.Spreadsheet.Charts.ChartType.Bubble, 100, 150, 400, 300, false);
VB
' Bubble chart.
Dim dataArray As Object(,) = {
         {28604, 77, 176869, 74, 6709669},
          {41163, 77.4, 276640, 71.8, 476640},
          {3516, 68, 1154657, 78, 1646773},
          {13670, 74.7, 102082, 72.7, 4952082},
          {28599, 75, 4986705, 79, 1986705},
          {29476, 77.1, 1943299, 82.1, 2243299},
          {31476, 75.4, 1958237, 79.4, 1858237},
          {28666, 78.1, 254830, 74.1, 954830},
          {4777, 57.7, 8706076, 67.7, 601776},
          {29550, 79.1, 1229285, 82.1, 2249285}}
For i = 0 To dataArray.GetLength(0) - 1
        For j = 0 To dataArray.GetLength(1) - 1
            spreadSheet1.Workbook.ActiveSheet.Cells(i, j).Value = dataArray(i, j)
        Next
Next
spreadSheet1.Workbook.ActiveSheet.Cells("A1:E10").Select()
spreadSheet1.Workbook.ActiveSheet.Shapes.AddChart(GrapeCity.Spreadsheet.Charts.ChartType.Bubble, 100, 150, 400, 300, False)