- 2D Chart for WinForms Overview
- Key Features
- Chart for WinForms Quick Start
- Design-Time Support
- Chart Fundamentals
- Common Usage for Basic 2D Charts
- Specific 2D Charts
- Design-Time Tools for Creating 2D Charts
- Charting Data
- Data Binding
- Charting Labels
- Chart Area and Plot Area Objects
- Customizing Chart Elements
- Loading and Saving Charts, Data, and Images
- End-User Interaction
- Chart for WinForms Samples
- Chart for WinForms Tutorials
-
Chart for WinForms Task-Based Help
- Rotating the Y-Axis Title
- Rotating Data Labels
- Displaying the Data Label as a Percent in Pie Charts
- Setting the Font Style for Data Labels
- Adding a Data Label on Top of Each Bar
- Wrapping Labels
- Adding a Transparent Label to Adjust the Gap Between the Values and the X-Axis
- Displaying both the Chart Legend and Chart Header
- Displaying the Legends Vertically
- Getting the Slice of a Pie with a Click
- Creating a Marker
- Add Scrollbar to the X-Axis and Y-Axis
- Add Symbols to Data Series
- Add ToolTips to Chart Elements
- Adding Visual Effects to Chart Elements
- Creating and Formatting Chart Elements Using the Properties Window
-
Creating and Formatting Chart Elements Using the Smart Designer
- Add a Chart Footer
- Add a Chart Header
- Add a Chart Legend
- Add Data Series to the Chart
- Add Data to the Data Series
- Add Labels to the Chart
- Choose a Chart Type
- Choose a Chart sub-type
- Edit the Chart Labels
- Edit the X and Y Axis
- Modify the Appearance of the Chart Footer
- Modify the Appearance of the Chart Header
- Modify the Appearance of the Chart Legend
- Modify the Appearance of the Data Series
- Modify the Color Theme of the Data Series
- Attach Chart Labels
- Candle Chart Tasks
- Frequently Asked Questions
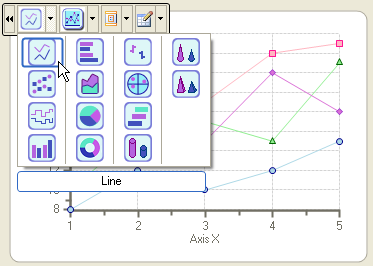
Choose a Chart Type
To select a chart type through the C1Chart floating toolbar, complete the following steps:
- Select the C1Chart control and click on the Open button
 to open the C1Chart floating toolbar.
 - Click the Chart type drop-down arrow and choose the Line chart type from the list.
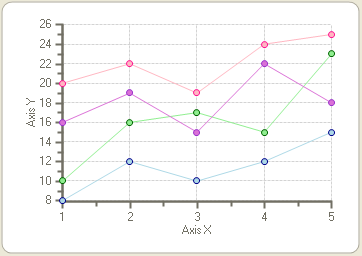
The Line chart type appears on the C1Chart control.