- 2D Chart for WinForms Overview
- Key Features
- Chart for WinForms Quick Start
- Design-Time Support
- Chart Fundamentals
- Common Usage for Basic 2D Charts
- Specific 2D Charts
- Design-Time Tools for Creating 2D Charts
- Charting Data
- Data Binding
- Charting Labels
- Chart Area and Plot Area Objects
- Customizing Chart Elements
- Loading and Saving Charts, Data, and Images
- End-User Interaction
- Chart for WinForms Samples
- Chart for WinForms Tutorials
-
Chart for WinForms Task-Based Help
- Rotating the Y-Axis Title
- Rotating Data Labels
- Displaying the Data Label as a Percent in Pie Charts
- Setting the Font Style for Data Labels
- Adding a Data Label on Top of Each Bar
- Wrapping Labels
- Adding a Transparent Label to Adjust the Gap Between the Values and the X-Axis
- Displaying both the Chart Legend and Chart Header
- Displaying the Legends Vertically
- Getting the Slice of a Pie with a Click
- Creating a Marker
- Add Scrollbar to the X-Axis and Y-Axis
- Add Symbols to Data Series
- Add ToolTips to Chart Elements
- Adding Visual Effects to Chart Elements
- Creating and Formatting Chart Elements Using the Properties Window
- Creating and Formatting Chart Elements Using the Smart Designer
- Candle Chart Tasks
- Frequently Asked Questions
Add ToolTips to Chart's Points in the Data Series
To add ToolTips to the Chart's DataSeries, complete the following steps:
Add C1Chart to the Form.
Add the following directive to declare the C1.Win.C1Chart namepace:
To write code in Visual Basic
Imports C1.Win.C1ChartTo write code in C#
using C1.Win.C1Chart;Add the following code in the Form_load procedure to declare the dataseries and add the tooltips to the dataseries:
To write code in Visual Basic
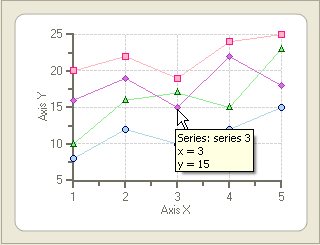
C1Chart1.ToolTip.Enabled = True
Dim sc As ChartDataSeriesCollection = C1Chart1.ChartGroups(0).ChartData.SeriesList
For Each ds As ChartDataSeries In sc
    ds.TooltipText = "Series: {#TEXT}" + ControlChars.Cr + ControlChars.Lf + "x = {#XVAL}" + ControlChars.Cr + ControlChars.Lf + "y = {#YVAL}"
Next ds
To write code in C#
ChartDataSeriesCollection sc =
c1Chart1.ChartGroups[0].ChartData.SeriesList;
  foreach (ChartDataSeries ds in sc)
     ds.TooltipText = "Series: {#TEXT}" + '\r' + '\n' + "x = {#XVAL}" + '\r' + '\n' + "y = {#YVAL}";
// Enable tooltip
c1Chart1.ToolTip.Enabled = true;
This topic illustrates the following:
When you hover over the points in the data series on the chart area at run time, the tooltips appear for each point, like the following: