
- Document Solutions for Excel .NET Overview
- Key Features
- Getting Started
- Features
- Templates
-
Formula Reference
- Add-in and Automation Functions
- Compatibility Functions
- Database Functions
- Date and Time Functions
- Engineering Functions
- Financial Functions
- Information Functions
- Logical Functions
- Lookup and Reference Functions
- Math and Trigonometry Functions
-
Statistical Functions
- AVEDEV
- AVERAGE
- AVERAGEA
- AVERAGEIF
- AVERAGEIFS
- BETA.DIST
- BETA.INV
- BINOM.DIST
- BINOM.DIST.RANGE
- BINOM.INV
- CHISQ.DIST
- CHISQ.DIST.RT
- CHISQ.INV
- CHISQ.INV.RT
- CHISQ.TEST
- CONFIDENCE.NORM
- CONFIDENCE.T
- CORREL
- COUNT
- COUNTA
- COUNTBLANK
- COUNTIF
- COUNTIFS
- COVARIANCE.P
- COVARIANCE.S
- DEVSQ
- EXPON.DIST
- F.DIST
- F.DIST.RT
- F.INV
- F.INV.RT
- F.TEST
- FISHER
- FISHERINV
- FORECAST
- FORECAST.LINEAR
- FREQUENCY
- GAMMA
- GAMMA.DIST
- GAMMA.INV
- GAMMALN
- GAMMALN.PRECISE
- GAUSS
- GEOMEAN
- GROWTH
- HARMEAN
- HYPGEOM.DIST
- INTERCEPT
- KURT
- LARGE
- LINEST
- LOGEST
- LOGNORM.DIST
- LOGNORM.INV
- MAX
- MAXA
- MAXIFS
- MEDIAN
- MIN
- MINA
- MINIFS
- MODE.MULT
- MODE.SNGL
- NEGBINOM.DIST
- NORM.DIST
- NORM.S.DIST
- NORM.S.INV
- NORMINV
- PEARSON
- PERCENTILE.EXC
- PERCENTILE.INC
- PERCENTRANK.EXC
- PERCENTRANK.INC
- PERMUT
- PERMUTATIONA
- PHI
- POISSON.DIST
- PROB
- QUARTILE.EXC
- QUARTILE.INC
- RANK.AVG
- RANK.EQ
- RSQ
- SKEW
- SKEW.P
- SLOPE
- SMALL
- STANDARDIZE
- STDEV.P
- STDEV.S
- STDEVA
- STDEVPA
- STEYX
- T.DIST
- T.DIST.2T
- T.DIST.RT
- T.INV
- T.INV.2T
- T.TEST
- TREND
- TRIMMEAN
- VAR.P
- VAR.S
- VARA
- VARPA
- WEIBULL.DIST
- Z.TEST
- Text Functions
- Web Functions
- File Operations
- Document Solutions Data Viewer
- Tutorials
- API Reference
- Release Notes
STDEV.S
This function returns the standard deviation based on a sample (of numeric values).
Syntax
STDEV.S(value1, [value2], ...)
Arguments
This function has these arguments:
Argument | Description |
|---|---|
value1 | [Required] The first value argument corresponding to a sample of a population. You can also use a single array or a reference to an array instead of arguments separated by commas |
value2 | [Optional] Value arguments 2 to 254 corresponding to a sample of a population. You can also use a single array or a reference to an array instead of arguments separated by commas |
Each argument can be a cell, a cell range, a float value, or an integer value. This function can have up to 255 arguments.
Remarks
The standard deviation is a measure of how widely values are dispersed from the average value. If your data represents the entire population, then compute the standard deviation using the STDEV.P function.
The standard deviation is calculated using the "n-1" method.
Logical values and text representations of numbers that are typed into the list of arguments are counted. If an argument is an array or reference, only numbers in that array or reference are counted. Empty cells, error values, logical values, or text in the array or reference are ignored.
The equation for calculating the standard deviation for a population is:
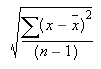
where x is the sample mean, AVERAGE(number1,number2,…), and n is the number of values.
Examples
STDEV.S(A1,B2,C3,D4,E5,F6)
STDEV.S(A1:A9)
STDEV.S(R1C2,R3C4,R4C5,R7C2)
STDEV.S(95,89,73,87,85,76,100,96,96) gives the result 9.342257638161012