
Create Custom Legend Icon
By default, the FlexChart control assigns color to each series and creates a legend icon based on the color assigned to the corresponding series. However, you can also create a custom legend icon. For instance, it would make it easier for user to read the data if country flags are displayed as legend icons while showing data for different countries.
To customize the legend icon once you have created a chart, you must create a custom series that inherits the Series class and ISeries interface. This interface provides the GetLegendItemImageSource method that lets you access the source of legend icon and hence customize the same by setting the flag image inside the legend icon box. This walkthrough takes you through the following detailed steps to create a custom legend icon.
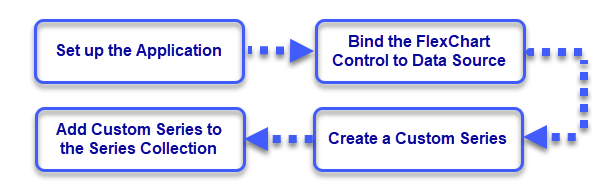
Set up the Application
Create a new Windows Forms app.
Drag and drop the FlexChart control from the toolbox onto the form.
Observe: A column type chart is drawn with a default data.
Bind the FlexChart Control to a Data Source
Create a data source.
// Method for creating data for FlexChart
public static List<SmartPhoneVendor> SmartPhoneVendors()
{
    List<SmartPhoneVendor> vendors = new List<SmartPhoneVendor>();
    vendors.Add(new SmartPhoneVendor()
    {
        Name = "Apple",
        Sales = 215.2
    });
    vendors.Add(new SmartPhoneVendor()
    {
        Name = "Huawei",
        Sales = 139
    });
    vendors.Add(new SmartPhoneVendor()
    {
        Name = "Lenovo",
        Sales = 50.7
    });
    vendors.Add(new SmartPhoneVendor()
    {
        Name = "LG",
        Sales = 55.1,
    });
    vendors.Add(new SmartPhoneVendor()
    {
        Name = "Oppo",
        Sales = 92.5
    });
    vendors.Add(new SmartPhoneVendor()
    {
        Name = "Samsung",
        Sales = 310.3
    });
    vendors.Add(new SmartPhoneVendor()
    {
        Name = "Vivo",
        Sales = 71.7
    });
    vendors.Add(new SmartPhoneVendor()
    {
        Name = "Xiaomi",
        Sales = 61
    });
    vendors.Add(new SmartPhoneVendor()
    {
        Name = "ZTE",
        Sales = 61.9
    });
    return vendors;
}
' Method for creating data for FlexChart Public Shared Function SmartPhoneVendors() As List(Of SmartPhoneVendor) Dim vendors As New List(Of SmartPhoneVendor)() vendors.Add(New SmartPhoneVendor() With { .Name = "Apple", .Sales = 215.2 }) vendors.Add(New SmartPhoneVendor() With { .Name = "Huawei", .Sales = 139 }) vendors.Add(New SmartPhoneVendor() With { .Name = "Lenovo", .Sales = 50.7 }) vendors.Add(New SmartPhoneVendor() With { .Name = "LG", .Sales = 55.1 }) vendors.Add(New SmartPhoneVendor() With { .Name = "Oppo", .Sales = 92.5 }) vendors.Add(New SmartPhoneVendor() With { .Name = "Samsung", .Sales = 310.3 }) vendors.Add(New SmartPhoneVendor() With { .Name = "Vivo", .Sales = 71.7 }) vendors.Add(New SmartPhoneVendor() With { .Name = "Xiaomi", .Sales = 61 }) vendors.Add(New SmartPhoneVendor() With { .Name = "ZTE", .Sales = 61.9 }) Return vendors End FunctionBind the FlexChart to this data source by setting the DataSource property.
Configure the X and Y axes by setting the BindingX and Binding property.
Configure the chart by setting the ChartType and other required properties.
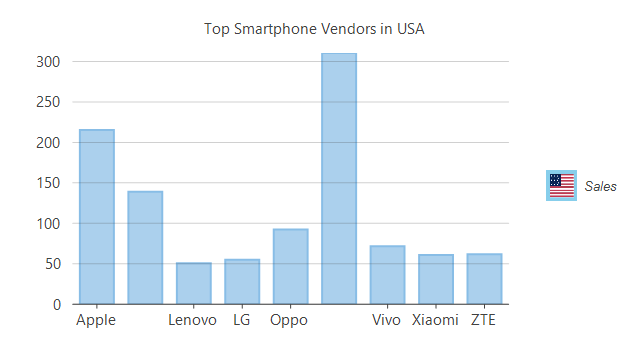
//Setting FlexChart's Header
flexChart1.Header.Content = "Top Smartphone Vendors in USA";
//Passing data in FlexChart
flexChart1.DataSource = vendors;
//Binding FlexChart's AxisX to 'Name' so vendor names appear in Horizontal axis
flexChart1.BindingX = "Name";
//Binding FlexChart to 'Sales' so their market share appears in Vertical axis
flexChart1.Binding = "Sales";
'Setting FlexChart's Header flexChart1.Header.Content = "Top Smartphone Vendors in USA" 'Passing data in FlexChart flexChart1.DataSource = vendors 'Binding FlexChart's AxisX to 'Name' so vendor names appear in Horizontal axis flexChart1.BindingX = "Name" 'Binding FlexChart to 'Sales' so their market share appears in Vertical axis flexChart1.Binding = "Sales"
Create a Custom Series
Create a series of custom type inherited from the Series class and ISeries interface. In this example, we have created a class named SeriesWithPointLegendItems.2. Implement the ISeries.GetLegendItemImageSource method to access the size of the legend and to draw the icon using the Graphics.DrawImage method for the legend point.
You can also set the legend icon size to adjust according to the window size.
public class SeriesWithPointLegendItems : Series, ISeries
{
    object ISeries.GetLegendItemImageSource(int index, ref C1.Chart._Size imageSize)
    {
        {
            imageSize.Height = 80;
            imageSize.Width = 130;
            SmartPhoneVendor vendor = vendors.ElementAt(index);
            Bitmap bm = new Bitmap(Properties.Resources.US);
            Image LegendIconImage = bm;
            if (LegendIconImage != null && LegendIconImage.Width != 130)
            {
                Bitmap bmp = new Bitmap(130, 80);
                using (SolidBrush sb = new SolidBrush(Color.White))
                {
                    using (Graphics g = Graphics.FromImage(bmp))
                    {
                        Rectangle r = new Rectangle(0, 0, (int)imageSize.Width, (int)imageSize.Height);
                        using (Pen p = new Pen(sb))
                        {
                            g.DrawRectangle(p, r);
                        }
                        g.FillRectangle(new SolidBrush(Color.SkyBlue), r);
                        Point ci = new Point((int)(0.5 * Math.Abs(imageSize.Width - LegendIconImage.Width)),
                            (int)(0.5 * Math.Abs(imageSize.Height - LegendIconImage.Height)));
                        g.DrawImage(LegendIconImage, ci);
                    }
                }
                LegendIconImage = bmp;
            }
            // Keep the original size of the logo bitmaps, but reduce their size if the chart window
            // is too small to display the bitmaps properly.
            Size bounds = this.Chart.ClientSize;
            double divadj = (bounds.Height > 700) ? 5 : 11;
            double fracHeight = bounds.Height / divadj;
            if (fracHeight < imageSize.Height)
                imageSize.Width = imageSize.Height = fracHeight;
            return LegendIconImage;
        }
    }
}
Public Class SeriesWithPointLegendItems Inherits Series Implements ISeries Private Function ISeries_GetLegendItemImageSource(index As Integer, ByRef imageSize As C1.Chart._Size) As Object Implements ISeries.GetLegendItemImageSource If True Then imageSize.Height = 80 imageSize.Width = 130 Dim vendor As SmartPhoneVendor = vendors.ElementAt(index) Dim bm As New Bitmap(Sample10.Resources.US) Dim LegendIconImage As Image = bm If LegendIconImage IsNot Nothing AndAlso LegendIconImage.Width <> 130 Then Dim bmp As New Bitmap(130, 80) Using sb As New SolidBrush(Color.White) Using g As Graphics = Graphics.FromImage(bmp) Dim r As New Rectangle(0, 0, CInt(Math.Truncate(imageSize.Width)), CInt(Math.Truncate(imageSize.Height))) Using p As New Pen(sb) g.DrawRectangle(p, r) End Using g.FillRectangle(New SolidBrush(Color.SkyBlue), r) Dim ci As Point = New Point(CInt((0.5 * Math.Abs(imageSize.Width - LegendIconImage.Width))), CInt((0.5 * Math.Abs(imageSize.Height - LegendIconImage.Height)))) g.DrawImage(LegendIconImage, ci) End Using End Using LegendIconImage = bmp End If ' Keep the original size of the logo bitmaps, but reduce their size if the chart window ' is too small to display the bitmaps properly. Dim bounds As Size = Me.Chart.ClientSize Dim divadj As Double = If((bounds.Height > 700), 5, 11) Dim fracHeight As Double = bounds.Height / divadj If fracHeight < imageSize.Height Then imageSize.Width = InlineAssignHelper(imageSize.Height, fracHeight) End If Return LegendIconImage End If End Function Private Shared Function InlineAssignHelper(Of T)(ByRef target As T, value As T) As T target = value Return value End Function End Class
Add the Custom Series to Series Collection
Clear the default series getting displayed in the chart.
Create an object of the custom series class, SeriesWithPointLegendItems in this case.
Add this object to the chart Series collection using the Add method .
//Clear the default series
flexChart1.Series.Clear();
//Creating custom series that shows legends with images, filled with color and categrozied in groups
_customSeries = new SeriesWithPointLegendItems
{
    Name = "Sales",
};
//Adding custom series to FlexChart
flexChart1.Series.Add(_customSeries);
'Clear the default series flexChart1.Series.Clear() 'Creating custom series that shows legends with images, filled with color and categrozied in groups _customSeries = New SeriesWithPointLegendItems() With { .Name = "Sales" } 'Adding custom series to FlexChart flexChart1.Series.Add(_customSeries)
Run the application to observe that a country flag surrounded by border of series color appears as a custom legend icon in the chart. Similarly, multiple legend icons can be customized in the case of multiple series and charts. For detailed implementation of custom legend icons, see FlexChartExplorer sample which is shipped with the control. To see this feature in action, you can also download the FlexChartExplorer demo from our website.