
Create Chart Callouts
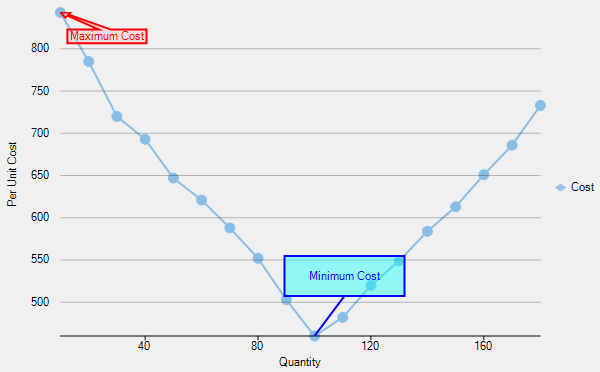
Chart callouts are visual tools that help in emphasizing a specific series or data point on a chart, through a line or arrow from the point to be highlighted to a box with information text. These callouts not only supplement charts with additional information but also help in easy comprehension as they are directly connected to the point of emphasis. For instance, chart callouts can make it easy to indicate the values corresponding to maximum and minimum cost as shown in the example below.
In FlexChart, you can create chart callouts using the Polygon type annotations by carrying out the following simple steps. In this example, we have demonstrated two type of callouts, one with simple line connector and other one with the arrow connector.
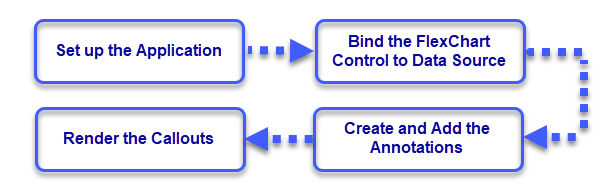
Set up the Application
Create a new Windows Forms app.
Drag and drop the FlexChart control from the toolbox onto the form.
Observe: A column type chart is drawn with a default data.
Bind the FlexChart Control to a Data Source
Create a data source.
public class DataService
{
    static Random rnd = new Random();
    public static List<UnitsCost> GetUnitCostData()
    {
        var data = new List<UnitsCost>();
        var date = new DateTime(2017, 1, 1);
        int cost = 900;
        for (int i = 10; i <= 180; i += 10)
        {
            cost += i <= 100 ? -rnd.Next(20, 70) : rnd.Next(20, 50);
            data.Add(new UnitsCost
            {
                Units = i,
                Cost = cost,
            });
        }
        return data;
    }
}
Public Class DataService Shared rnd As New Random() Public Shared Function GetUnitCostData() As List(Of UnitsCost) Dim data As List(Of UnitsCost) = New List(Of UnitsCost)() Dim [date] As DateTime = New DateTime(2017, 1, 1) Dim cost As Integer = 900 For i As Integer = 10 To 180 Step 10 cost += If(i <= 100, -rnd.[Next](20, 70), rnd.[Next](20, 50)) data.Add(New UnitsCost() With { .Units = i, .Cost = cost }) Next Return data End Function End ClassBind the FlexChart to this data source by setting the DataSource property.
Clear the default series getting displayed in the chart and add a new series using the Add method.
Configure the X and Y axes by setting the BindingX and Binding property.
Configure the chart by setting the ChartType and other required properties.
Initialize the Rendering event of FlexChart to call the custom method SetupAnnotations which is implemented in the following steps to create the callouts.
protected void SetupChart()
{
       _data = DataService.GetUnitCostData();
//     this.flexChart1.Header.Content = "Relationship between Production and Cost";

    this.flexChart1.Binding = "Cost";
    this.flexChart1.BindingX = "Units";
    this.flexChart1.DataSource = _data;
    this.flexChart1.ChartType = ChartType.LineSymbols;
    this.flexChart1.Series.Add(new Series() { Name = "Cost" });
    this.flexChart1.AxisX.Title = "Quantity";
    this.flexChart1.AxisY.Title = "Per Unit Cost";
    this.flexChart1.Rendering += FlexChart1_Rendering;
}
Protected Sub SetupChart() _data = DataService.GetUnitCostData() ' this.flexChart1.Header.Content = "Relationship between Production and Cost"; Me.flexChart1.Binding = "Cost" Me.flexChart1.BindingX = "Units" Me.flexChart1.DataSource = _data Me.flexChart1.ChartType = ChartType.LineSymbols Me.flexChart1.Series.Add(New Series() With { .Name = "Cost" }) Me.flexChart1.AxisX.Title = "Quantity" Me.flexChart1.AxisY.Title = "Per Unit Cost" AddHandler Me.flexChart1.Rendering, AddressOf FlexChart1_Rendering End Sub
Create and Add the Annotations
Create an annotation layer by creating an instance of the AnnotationLayer class.
Create a line callout by creating an instance of the Polygon class.
Specify the points to create the line callout and set the related properties to attach and style the annotation.
Create a custom method, GetArrowCalloutPoints in this case, to measure the size of annotation text and calculate the coordinates for arrow callout annotation accordingly.
Create an arrow callout by creating another instance of the Polygon class.
Call the GetArrowCalloutPoints method and specify other related properties to attach and style the annotation.
Add the two annotations in the annotation layer using the Add method.
private void SetupAnnotations()
{
    var annotationLayer = new AnnotationLayer(this.flexChart1);
    var orderedCost = _data.OrderBy(x => x.Cost).ToList();
    var arrowCallout = new Polygon("Maximum Cost")
    {
        Attachment = AnnotationAttachment.DataIndex,
        SeriesIndex = 0,
        PointIndex = _data.IndexOf(orderedCost[_data.Count - 1]),
    };
    arrowCallout.Style.FillColor = Color.FromArgb(100, Color.Pink);
    arrowCallout.Style.StrokeColor = Color.Red;
    arrowCallout.ContentStyle.StrokeColor = Color.Red;
    foreach (PointF point in GetArrowCalloutPoints(arrowCallout, orderedCost[_data.Count - 1]))
    {
        arrowCallout.Points.Add(point);
    }
    var lineCallout = new Polygon("Minimum Cost")
    {
        Attachment = AnnotationAttachment.DataIndex,
        SeriesIndex = 0,
        PointIndex = _data.IndexOf(orderedCost[0]),
        ContentCenter = new PointF(30, -60),
        Points = { new PointF(0, 0), new PointF(30, -40), new PointF(-30, -40), new PointF(-30, -80), new PointF(90, -80), new PointF(90, -40), new PointF(30, -40) }
    };
    lineCallout.Style.FillColor = Color.FromArgb(100, Color.Aqua);
    lineCallout.Style.StrokeColor = Color.Blue;
    lineCallout.ContentStyle.StrokeColor = Color.Blue;
    annotationLayer.Annotations.Add(arrowCallout);
    annotationLayer.Annotations.Add(lineCallout);
}
Private Sub SetupAnnotations() Dim annotationLayer As AnnotationLayer = New AnnotationLayer(Me.flexChart1) Dim orderedCost As List(Of UnitsCost) = _data.OrderBy(Function(x) x.Cost).ToList() Dim arrowCallout As Polygon = New Polygon("Maximum Cost") With { .Attachment = AnnotationAttachment.DataIndex, .SeriesIndex = 0, .PointIndex = _data.IndexOf(orderedCost(_data.Count - 1)) } arrowCallout.Style.FillColor = Color.FromArgb(100, Color.Pink) arrowCallout.Style.StrokeColor = Color.Red arrowCallout.ContentStyle.StrokeColor = Color.Red For Each point As PointF In GetArrowCalloutPoints(arrowCallout, CType(orderedCost(_data.Count - 1), UnitsCost)) arrowCallout.Points.Add(point) Next Dim lineCallout As Polygon = New Polygon("Minimum Cost") With { .Attachment = AnnotationAttachment.DataIndex, .SeriesIndex = 0, .PointIndex = _data.IndexOf(CType(orderedCost(0), UnitsCost)), .ContentCenter = New PointF(30, -60) } lineCallout.Points.Add(New PointF(0, 0)) lineCallout.Points.Add(New PointF(30, -40)) lineCallout.Points.Add(New PointF(-30, -40)) lineCallout.Points.Add(New PointF(-30, -80)) lineCallout.Points.Add(New PointF(-30, -80)) lineCallout.Points.Add(New PointF(90, -80)) lineCallout.Points.Add(New PointF(90, -40)) lineCallout.Points.Add(New PointF(30, -40)) lineCallout.Style.FillColor = Color.FromArgb(100, Color.Aqua) lineCallout.Style.StrokeColor = Color.Blue lineCallout.ContentStyle.StrokeColor = Color.Blue annotationLayer.Annotations.Add(arrowCallout) annotationLayer.Annotations.Add(lineCallout) End Sub
Note that the custom method GetArrowCalloutPoints used in the step above to get the size of the annotation text and to calculate the polygon coordinates based on that can be implemented as follows.
Render the Callouts
Invoke the SetupAnnotations method in the Rendering event of the FlexChart class.
private void FlexChart1_Rendering(object sender, RenderEventArgs e)
{
    if (_renderEngine == null)
    {
        _renderEngine = e.Engine;
        SetupAnnotations();
    }
}
Private Sub FlexChart1_Rendering(sender As Object, e As RenderEventArgs) If _renderEngine Is Nothing Then _renderEngine = e.Engine SetupAnnotations() End If End SubRun the sample to render the chart with callouts.
Observe that a chart displaying a simple line callout and an arrow callout is displayed to indicate the data points related to minimum and maximum cost. Similarly, you can create callouts in the form of other polygons by measuring the size of text to be used and calculating the coordinates of the Polygon annotations accordingly. For detailed implementation, see FlexChartExplorer sample which is shipped with the control. To see this feature in action, you can also download the FlexChartExplorer demo from our website.