- Spread for WPF Overview
- About the Product
- Getting Started
- Quick Start
- Designer
- Features
- Assembly Reference
Customizing Pivot Table Fields
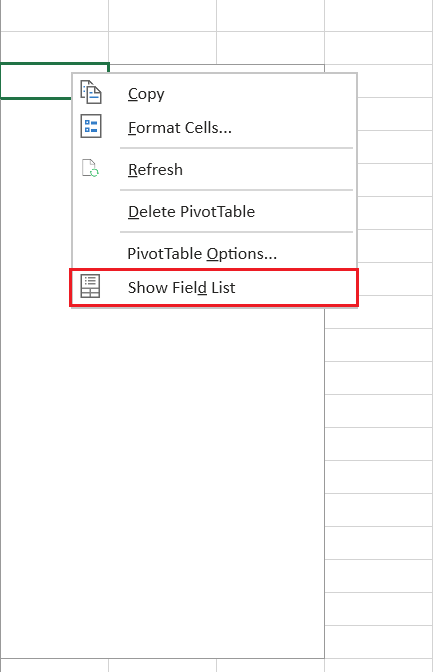
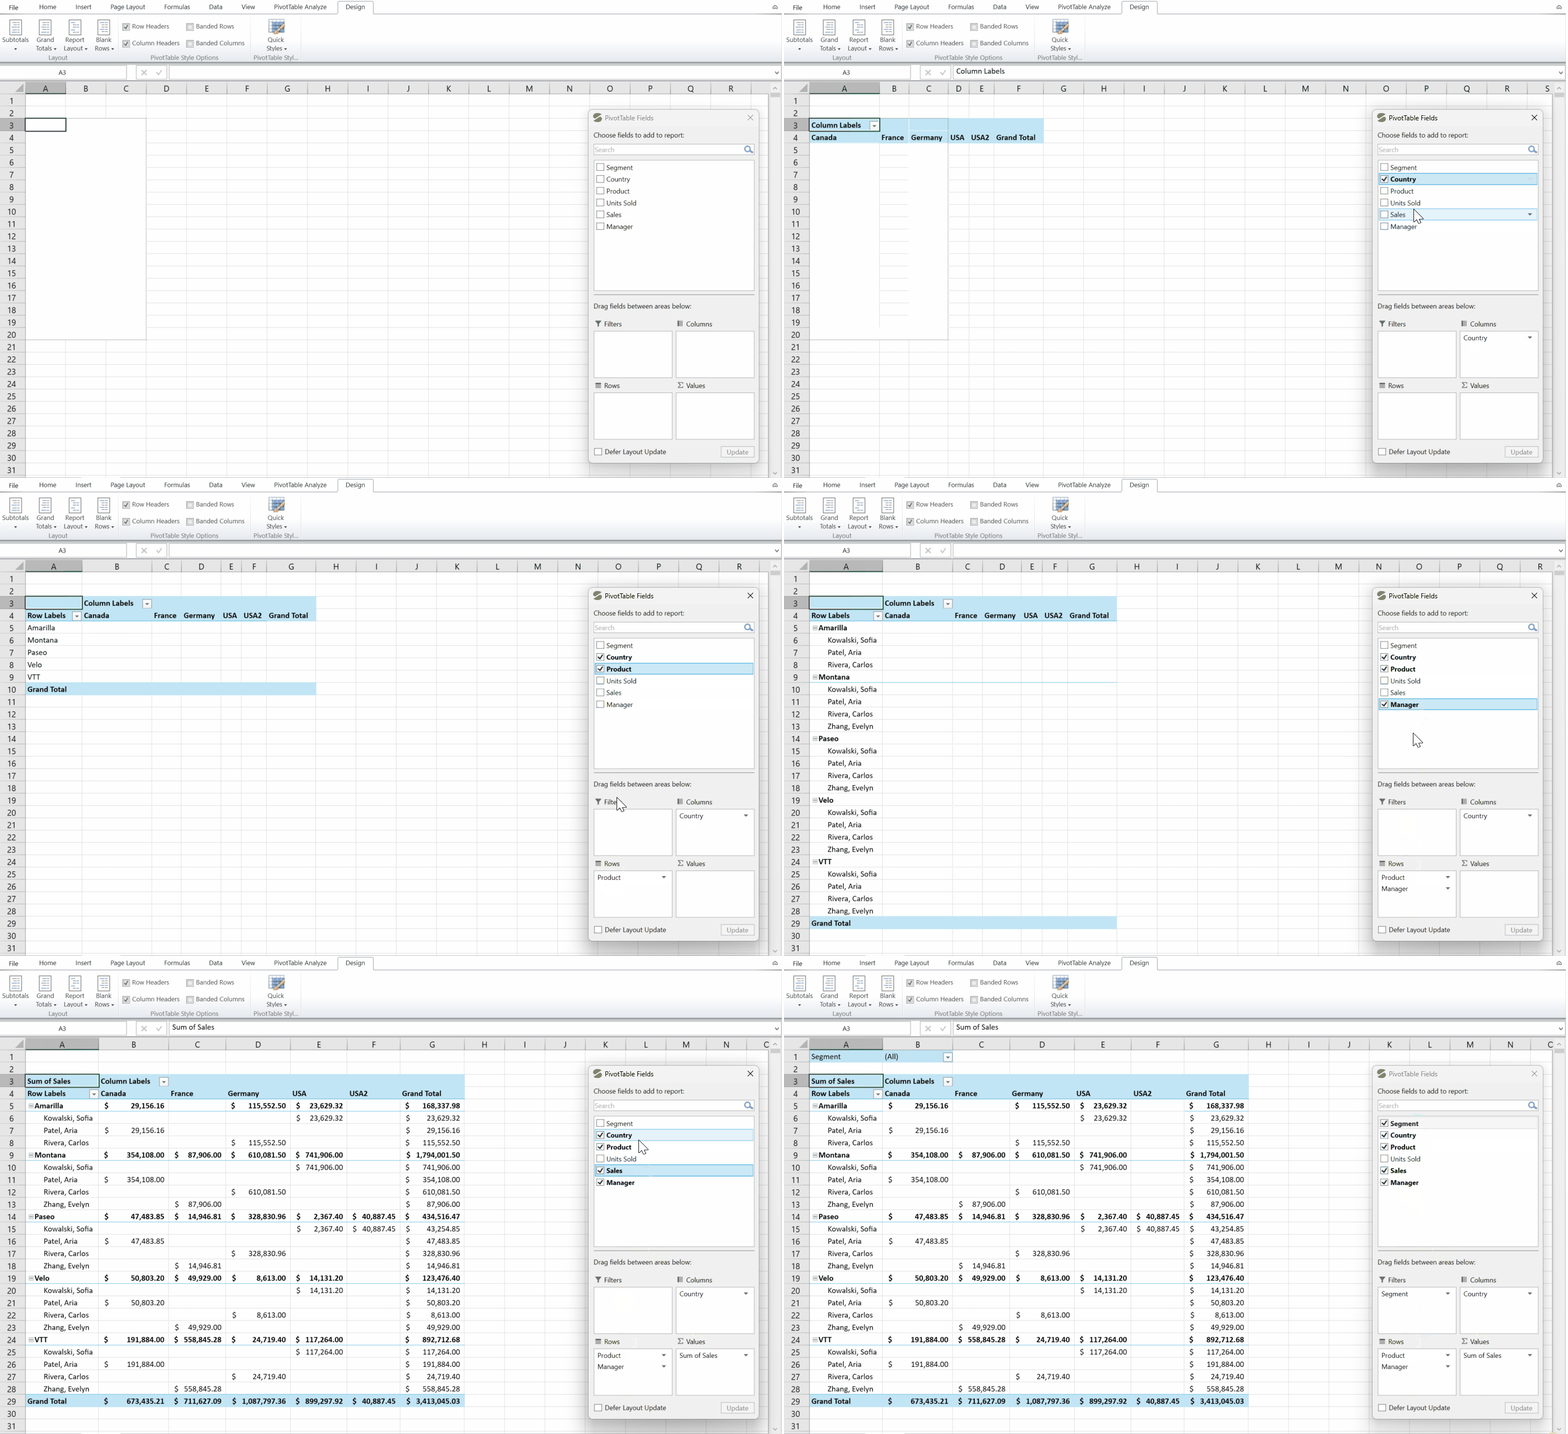
After inserting a pivot table, you can click Show Field List from its context menu, and then the PivotTable Fields dialog will appear with four areas: Filters, Columns, Rows, and Values.
You can freely drag fields into these areas to customize the layout of your pivot table.
Fields | Description |
|---|---|
Filters Field | The Filters field allows you to filter the entire pivot table based on selected values. |
Rows Field | Each item in the Rows field creates a new row, allowing you to group and summarize data by these values. |
Columns Field | Each item in the Columns field creates a new column, allowing you to compare data side by side. |
Values Field | The Values field is used to summarize numeric data, typically using functions such as Sum, Count, Average, Min, or Max. These fields are placed in the Values area, and the pivot table aggregates the data according to the chosen summary function. |
Field Options
When you click any item within a field area, the following options are available:
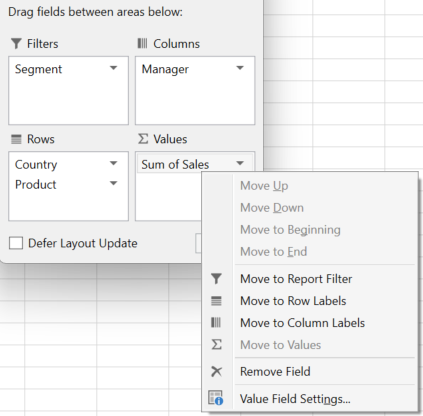
Options | Description |
|---|---|
Move Up | Move the selected field one position higher within the current area. |
Move Down | Move the selected field one position lower within the current area. |
Move to Beginning | Move the selected field to the first position in its current area. |
Move to End | Move the selected field to the last position in its current area. |
Move to Report Filter | Transfer the field to the Filters area, enabling filtering of the entire pivot table by this field. |
Move to Row Labels | Transfer the field to the Rows area, grouping data by this field in rows. |
Move to Column Labels | Transfer the field to the Columns area, grouping data by this field in columns. |
Move to Values | Transfer the field to the Values area, where data is aggregated (e.g., Sum, Count, Average). |
Remove Field | Remove the selected field from the pivot table layout. |
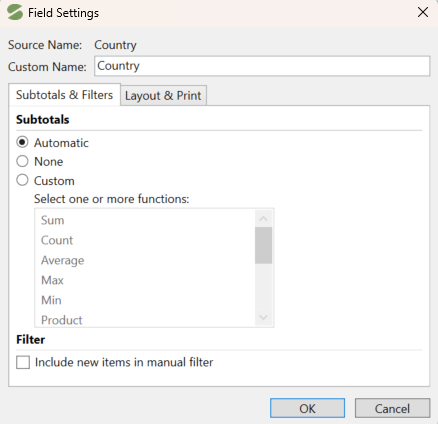
Field Settings | Open the Field Settings dialog, where you can rename the field, configure how subtotals are calculated, set filter options for new items, and adjust layout and print settings such as label display format, repeating item labels, and whether to show items with no data.
Note: This option is not available for fields in the Values area. |
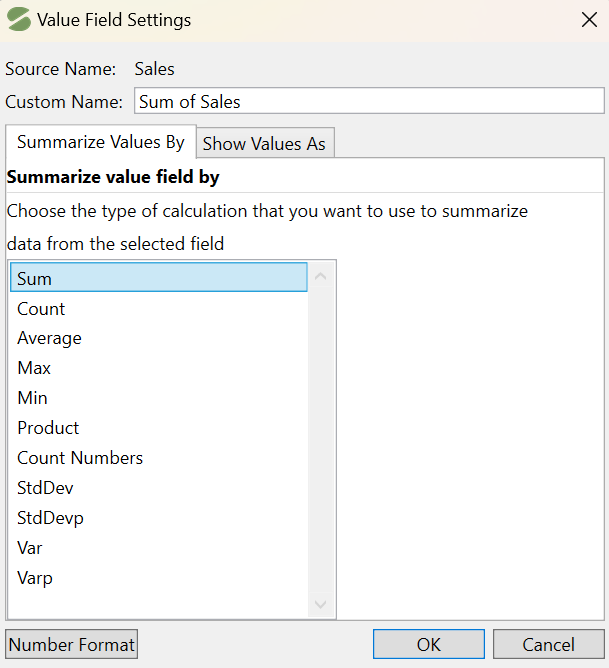
Value Field Settings | The Value Field Settings dialog allows you to change the summary function used to calculate values in the PivotTable (such as Sum, Count, Average, Min, Max, and more). You can also rename the field and format the displayed values. Use the Summarize Values By tab to select the calculation type, or use the Show Values As tab to display values as a percentage or other calculation.
Note: This option is only available for fields in the Values area. |