


Group Dialog
The Group dialog allows you to group the data by rows and columns that helps you summarize large datasets and create custom views in a worksheet. Customization options include hiding detail rows/columns, displaying summary rows/columns, and changing the grouping layout. It is particularly useful for establishing hierarchical relationships between rows and columns.
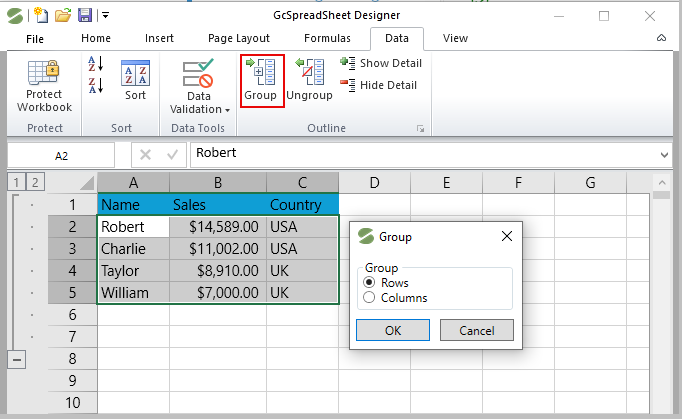
To open the Group dialog, select the Data tab and click Group button from the Outline group. Alternatively, you can use the keyboard shortcut Alt+A+G to open the Group dialog.
Note:
When grouping data, it is important to consider the level of granularity required for analysis and the potential impact on data aggregation.
To ensure optimal performance, avoid grouping too many rows or columns and limit the use of grouping to essential data only.
Grouping By Rows
Rows grouping involves aggregating data by rows into category headings, making it easier to collapse and expand.
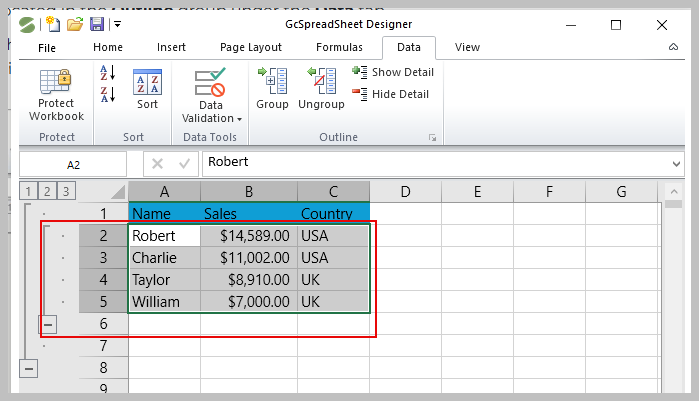
For instance, if we need to group the rows 2 to 5, select the relevant rows that need to be grouped and click on the ‘Group’ option. You will see that the selected rows will collapse into a single group.
The following image displays the grouping by rows using Group dialog.
Grouping by Columns
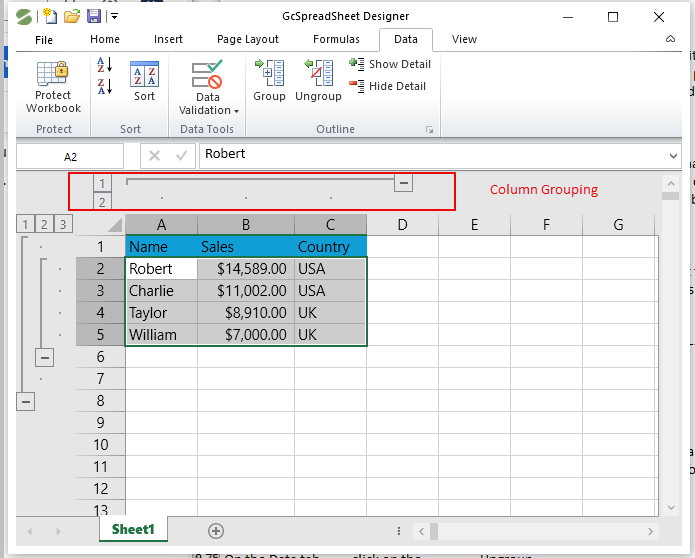
Column grouping involves aggregating data by column into category headings, reducing the amount of data shown on the screen.
The following image displays the grouping by columns using Group dialog.
Collapse/Expand Groups
The groups can be collapsed/expanded in following ways:
Using the Outline Symbols
When you group data in a worksheet, Spread draws outline bars next to column and row groups. Each outline bar has a plus + or minus - symbol that indicates the group state. To collapse a group, click the minus sign or the outline bar itself. To expand the group, click the plus sign.
You can also use the Hide Detail and Show Detail buttons in the Outline group under the Data tab to hide or show the detailed rows and columns in your grouped data.
Using the Outline buttons
Use the outline buttons 1 2 3 to collapse or expand multiple groups at once. Each outline button has a number that indicates the group level. The largest number is 8, because you can create up to seven group levels. Click the outline button 1 to collapse all groups. Click the outline button with the largest number to display all detail data.
Group Settings
You can specify a group’s direction using the Settings dialog. To invoke this dialog, click the Outline dialog launcher on the Data tab.
The image below displays the Settings dialog.
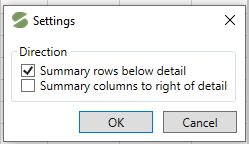
The Settings dialog has two direction options.
Summary rows below detail
Summary columns to right of detail
Select the required check boxes depending on where your summary rows or columns are located. For instance, if you insert summary rows above detail rows in each group, clear the Summary rows below detail checkbox.
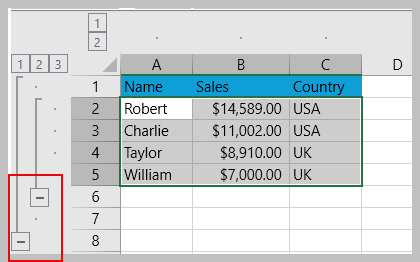
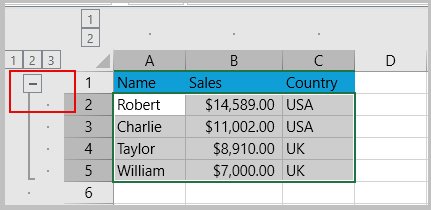
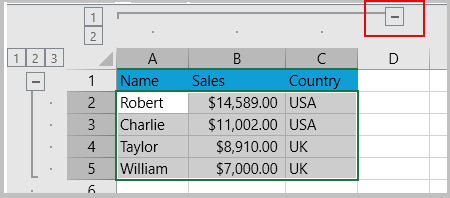
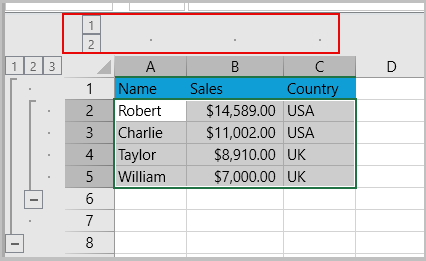
The table below displays the direction of summary of rows/columns as per the checkbox selected.
Direction option | Output Image when option is checked | Output Image when option is not checked |
|---|---|---|
Summary rows below detail |
|
|
Summary columns to right of detail |
|
|
Note: It is important to ungroup data once analysis is complete, to avoid any unintended consequences. You can do this by clicking on the Ungroup button in the Data tab in the Outline group for the selected grouped cell range.