
- ASP.NET MVC
- Getting Started
- Configuring your MVC Application
- Adding NuGet Packages to your App
- Adding Controls
- Client-Side Support
- Globalization
-
Working with Controls
- Accordion
- Barcode
- CollectionView
- DashboardLayout
- Excel
- File Manager
- Financial Charts
-
FlexChart
- Key Features
- Chart Elements
- Chart Types
- Quick Start
- Comparing MVC FlexCharts
- Work with FlexChart
- FlexGrid
- Transposed Grid
- FlexMap
- FlexPie
- FlexRadar
- FlexReport
- FlexSheet
- FlexViewer
- Gauge
- Input Controls
- MultiRow
- TransposedMultiRow
- OLAP
- Sunburst Chart
- TabPanel
- TreeMap
- TreeView
- Styling
- ASP.NET MVC Samples
- Release History
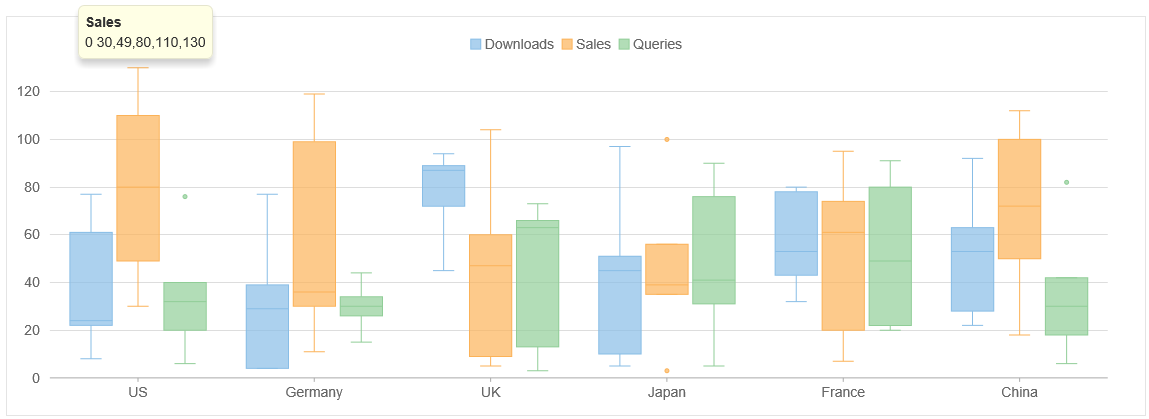
Box-and-Whisker
BoxWhisker chart series shows distribution of data into quartiles, highlighting the mean and the outliers. The boxes may have lines extending vertically called "whiskers". These lines indicate variability outside the upper and lower quartiles, and any point outside those lines or whiskers is considered an outlier.
They are most commonly used in statistical analysis. For example, you could use a box and whisker chart to compare medical trial results or teachers' test scores.
This topic describes how to use BoxWhisker series in your FlexChart to show distribution of data into quartiles, highlighting the mean and the outliers. To work with BoxWhisker Series, you need to create an instance of FlexChart class, which is a part of C1.Web.Mvc namespace. To do so, follow the steps given below:
Create a Datasource for FlexChart
Add a new class to the Models folder (for example:
ProductSales.cs).Add the following code to the new model to define a class which will serve as a datasource for the FlexChart.
using System.Collections.Generic;
using System.Linq;
namespace BoxWhiskerSeries.Models
{
    public class ProductSales
    {
        public int Id { get; set; }
        public string Country { get; set; }
        public List<int> Sales { get; set; }
        public List<int> Downloads { get; set; }
        public List<int> Queries { get; set; }
        public ProductSales(string country, int[] downloads, int[] sales, int[] queries)
        {
            Country = country;
            Sales = sales.ToList();
            Downloads = downloads.ToList();
            Queries = queries.ToList();
        }
        public static List<ProductSales> GetData()
        {
            int[][][] stats = {
new int[][]{ new int[] { 8, 22, 24, 61, 77 }, new int[] { 30, 49, 80, 110, 130 }, new int[] { 6, 20, 32, 40, 76 } },
new int[][]{ new int[] {4, 4, 29, 39, 77}, new int[] {11, 30, 36, 99, 119}, new int[] {15, 26, 30, 34, 44} },
new int[][]{ new int[] {45, 72, 87, 89, 94}, new int[] {5, 9, 47, 60, 104}, new int[] {3, 13, 63, 66, 73} },
new int[][]{ new int[] {5, 10, 45, 51, 97}, new int[] {3, 35, 39, 56, 100}, new int[] {5, 31, 41, 76, 90} },
new int[][]{ new int[] {32, 43, 53, 78, 80}, new int[] {7, 20, 61, 74, 95}, new int[] {20, 22, 49, 80, 91} },
new int[][]{ new int[] {22, 28, 53, 63, 92}, new int[] {18, 50, 72, 100, 112}, new int[] {6, 18, 30, 42, 82} }
};
            var countries = new string[] { "US", "Germany", "UK", "Japan", "France", "China" };
            var data = new List<ProductSales>();
            for (var i = 0; i < countries.Length; i++)
            {
                data.Add(new ProductSales(countries[i], stats[i][0], stats[i][1], stats[i][2]));
            }
            return data;
        }
    }
}
Add BoxWhisker Series to FlexChart
To add a FlexChart to the application, follow these steps:
Add a new Controller
In the Solution Explorer, right click the folder Controllers.
From the context menu, select Add | Controller. The Add Scaffold dialog appears.
In the Add Scaffold dialog, follow these steps:
- Select MVC 5 Controller - Empty template.
- Set name of the controller (for example:
BoxWhiskerController). - Click Add.
Replace the method Index() with the following method.
public ActionResult Index()
        {
            return View(ProductSales.GetData());
        }
Add a View for the Controller
From the Solution Explorer, expand the folder Controllers and double click the
BoxWhiskerController.Place the cursor inside the method
Index().Right click and select Add View. The Add View dialog appears.
In the Add View dialog, verify that the view name is Index and View engine is Razor (CSHTML).
Click Add. A view is added for the controller.
@using C1.Web.Mvc.Chart;
@using BoxWhiskerSeries.Models;
@model IEnumerable<ProductSales>
<br />
<br />
@(Html.C1().FlexChart()
.Bind("Country", "Downloads", Model)
.Series(ser =>
{
    ser.AddBoxWhisker().Name("Downloads");
    ser.AddBoxWhisker().Binding("Sales").Name("Sales").ShowOutliers(true);
    ser.AddBoxWhisker().Binding("Queries").Name("Queries").ShowOutliers(true);
})
.Legend(Position.Top))
Build and Run the Project
- Click Build | Build Solution to build the project.
- Press F5 to run the project.
type=note
Append the folder name and view name to the generated URL (for example: http://localhost:1234/ErrorBar/Index) in the address bar of the browser to see the view.