
- ASP.NET MVC
- Getting Started
- Configuring your MVC Application
- Adding NuGet Packages to your App
- Adding Controls
- Client-Side Support
- Globalization
-
Working with Controls
- Accordion
- Barcode
- CollectionView
- DashboardLayout
- Excel
- File Manager
- Financial Charts
- FlexChart
- FlexGrid
- Transposed Grid
- FlexMap
- FlexPie
- FlexRadar
- FlexReport
- FlexSheet
- FlexViewer
- Gauge
- Input Controls
- MultiRow
- TransposedMultiRow
- OLAP
- Sunburst Chart
- TabPanel
- TreeMap
- TreeView
- Styling
- ASP.NET MVC Samples
- Release History
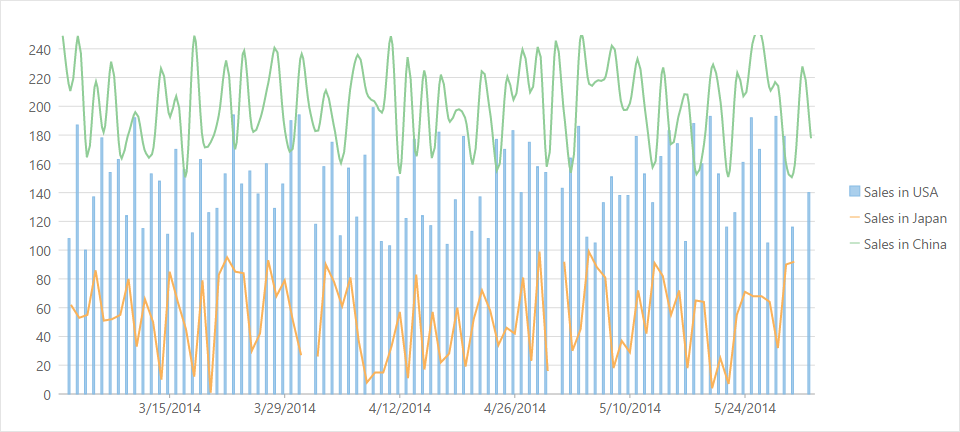
Mixed Charts
You can add multiple series to your charts and set a different ChartType for all the series. Such charts are helpful in analyzing complex chart data on a single canvas. The same data can be used with different visualizations or related data can be displayed together to convey trends.
The following image shows a FlexChart with multiple series.
The following code example demonstrates how to add multiple chart series with different ChartTypes to the FlexChart.
@*Initialize FlexChart*@
@(Html.C1().FlexChart()
.Bind("Date", Model)
//Add Series to the chart
.Series(sers =>
  {
      //Add the first series
      sers.Add()
     .Binding("SalesInUSA")
     .Name("Sales in USA")
     .ChartType(C1.Web.Mvc.Chart.ChartType.Column);
      //Add the second series
      sers.Add()
     .Binding("SalesInJapan")
     .Name("Sales in Japan")
     .ChartType(C1.Web.Mvc.Chart.ChartType.Line);
      //Add the third series
      sers.Add()
     .Binding("SalesInChina")
     .Name("Sales in China")
     .ChartType(C1.Web.Mvc.Chart.ChartType.Spline);
  })
)