- ASP.NET MVC
- Getting Started
- Configuring your MVC Application
- Adding NuGet Packages to your App
- Adding Controls
- Client-Side Support
- Globalization
-
Working with Controls
- Accordion
- Barcode
- CollectionView
- DashboardLayout
- Excel
- File Manager
- Financial Charts
- FlexChart
- FlexGrid
- Transposed Grid
- FlexMap
- FlexPie
- FlexRadar
- FlexReport
- FlexSheet
- FlexViewer
- Gauge
- Input Controls
- MultiRow
- TransposedMultiRow
- OLAP
- Sunburst Chart
- TabPanel
- TreeMap
- TreeView
- Styling
- ASP.NET MVC Samples
- Release History
Customize Axes
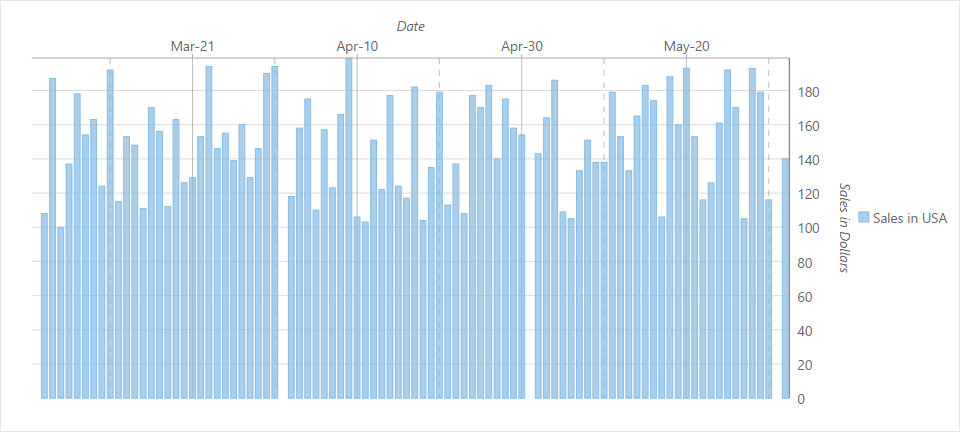
An axis is composed of several elements, such as labels, line, tick marks and titles. There are several properties available in FlexChart that let you customize these elements, for both X and Y axes. You can even change the position of the axes with the help of Position property.
The image below shows a FlexChart with customized axes.

The following code example demonstrates how to set this property. This example uses the sample created in the Quick Start section.
.AxisY(axis => axis
       .Position(C1.Web.Mvc.Chart.Position.Right)
       .MajorGrid(true).MajorUnit(20)
       .AxisLine(true)
       .Labels(true)
       .Title("Sales in Dollars")
    )
.AxisX(axis=>axis
       .Position(C1.Web.Mvc.Chart.Position.Top)
       .AxisLine(true)
       .MajorGrid(true)
       .MajorUnit(20)
       .MinorGrid(true)
       .Labels(true)
       .Title("Date")
       .Format("MMM-dd")
    )


