- ASP.NET MVC
- Getting Started
- Configuring your MVC Application
- Adding NuGet Packages to your App
- Adding Controls
- Client-Side Support
- Globalization
- Working with Controls
- Styling
- ASP.NET MVC Samples
- Release History
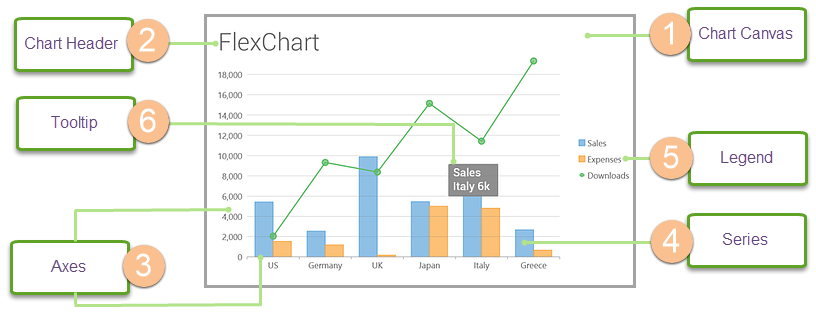
Chart Elements
FlexChart is composed of several elements as shown below:
| |||
|---|---|---|---|
| Chart Canvas | Area on which all chart elements including the series, axes title and legend are placed. | |
| Chart Header | Text that you want to display at the top of your chart, basically a title that serves as a heading for your chart. | |
| Axes | Two primary axes, X and Y. Although in some cases you may add secondary axes as well. | |
| Series | Collection of data that is plotted on the chart. | |
| Legend | Name of the series added in the chart along with predefined symbols and colors used to plot data for that series. | |
| Tooltip | Tooltips or labels that appear when you hover on a series. | |