
- ASP.NET MVC
- Getting Started
- Configuring your MVC Application
- Adding NuGet Packages to your App
- Adding Controls
- Client-Side Support
- Globalization
- Working with Controls
- Styling
- ASP.NET MVC Samples
- Release History
Quick Start
The quick start guides you through the steps of adding the FlexChart control to your MVC web application and add data to it.
Create an MVC Application
Create a new MVC application using the ComponentOne or VisualStudio templates. For more information about creating an MVC application, see Configuring your MVC Application topic.
Create a Data source for FlexChart
Add a new class to the folder Models (for example:
FlexChartDataSource.cs). See Adding controls to know how to add a new model.Add the following code to the new model to define the classes that serve as a datasource for the FlexChart control.
razor
public class FlexChartDataSource
{
    public string Name { get; set; }
    public int MarPrice { get; set; }
    public int AprPrice { get; set; }
    public int MayPrice { get; set; }
    private IEnumerable<FruitSale> _sales = null;
    public IEnumerable<FruitSale> Sales
    {
        get
        {
            if (_sales == null)
            {
                _sales = GetSales();
            }
            return _sales;
        }
    }
    public static IEnumerable<FlexChartDataSource> GetFruitsSales()
    {
        var rand = new Random(0);
        var fruits = new[] { "Oranges", "Apples", "Pears", "Bananas", "Pineapples" };
        var list = fruits.Select((f, i) =>
        {
            int mar = rand.Next(1, 6);
            int apr = rand.Next(1, 9);
            int may = rand.Next(1, 6);
            return new FlexChartDataSource { Name = f, MarPrice = mar, AprPrice = apr, MayPrice = may };
        });
        return list;
    }
    private IEnumerable<FruitSale> GetSales()
    {
        var rand = new Random(0);
        var today = DateTime.Now.Date;
        var firstDay = new DateTime(today.Year - 1, 3, 1);
        var dataTimes = new List<DateTime>();
        for (int i = 0; i < 92; i++)
        {
            dataTimes.Add(firstDay.AddDays(i + 1));
        }
        var list = dataTimes.Select((date, i) =>
        {
            FruitSale sale = new FruitSale { Date = date };
            sale.SalesInChina = rand.Next(150, 250);
            if (i % 30 != 0)
            {
                sale.SalesInUSA = rand.Next(100, 200);
                sale.SalesInJapan = rand.Next(0, 100);
            }
            else
            {
                sale.SalesInUSA = null;
                sale.SalesInJapan = null;
            }
            return sale;
        });
        return list;
    }
}
public class FruitSale
{
    public DateTime Date { get; set; }
    public int? SalesInUSA { get; set; }
    public int? SalesInChina { get; set; }
    public int? SalesInJapan { get; set; }
}
VB
Public Class FlexChartDataSource
    Public Property Name() As String
        Get
            Return m_Name
        End Get
        Set
            m_Name = Value
        End Set
    End Property
    Private m_Name As String
    Public Property MarPrice() As Integer
        Get
            Return m_MarPrice
        End Get
        Set
            m_MarPrice = Value
        End Set
    End Property
    Private m_MarPrice As Integer
    Public Property AprPrice() As Integer
        Get
            Return m_AprPrice
        End Get
        Set
            m_AprPrice = Value
        End Set
    End Property
    Private m_AprPrice As Integer
    Public Property MayPrice() As Integer
        Get
            Return m_MayPrice
        End Get
        Set
            m_MayPrice = Value
        End Set
    End Property
    Private m_MayPrice As Integer
    Private _sales As IEnumerable(Of FruitSale) = Nothing
    Public ReadOnly Property Sales() As IEnumerable(Of FruitSale)
        Get
            If _sales Is Nothing Then
                _sales = GetSales()
            End If
            Return _sales
        End Get
    End Property
    Public Shared Function GetFruitsSales() As IEnumerable(Of FlexChartDataSource)
        Dim rand = New Random(0)
        Dim fruits = New String() {"Oranges", "Apples", "Pears", "Bananas", "Pineapples"}
        Dim list = fruits.[Select](Function(f, i)
        Dim mar As Integer = rand.[Next](1, 6)
        Dim apr As Integer = rand.[Next](1, 9)
        Dim may As Integer = rand.[Next](1, 6)
        Return New FlexChartDataSource() With {
                Key.Name = f,
            Key.MarPrice = mar,
            Key.AprPrice = apr,
            Key.MayPrice = may
            }
End Function)
        Return list
    End Function
    Private Function GetSales() As IEnumerable(Of FruitSale)
        Dim rand = New Random(0)
        Dim today = DateTime.Now.[Date]
        Dim firstDay = New DateTime(today.Year - 1, 3, 1)
        Dim dataTimes = New List(Of DateTime)()
        For i As Integer = 0 To 91
            dataTimes.Add(firstDay.AddDays(i + 1))
        Next
        Dim list = dataTimes.[Select](Function([date], i)
        Dim sale As New FruitSale() With {
        Key.[Date] = [date]
        }
        sale.SalesInChina = rand.[Next](150, 250)
                If i Mod 30 <> 0 Then
        sale.SalesInUSA = rand.[Next](100, 200)
        sale.SalesInJapan = rand.[Next](0, 100)
                Else
        sale.SalesInUSA = Nothing
        sale.SalesInJapan = Nothing
                End If
        Return sale
        End Function)
        Return list
    End Function
End Class
Public Class FruitSale
    Public Property [Date]() As DateTime
        Get
            Return m_Date
        End Get
        Set
            m_Date = Value
        End Set
    End Property
    Private m_Date As DateTime
    Public Property SalesInUSA() As System.Nullable(Of Integer)
        Get
            Return m_SalesInUSA
        End Get
        Set
            m_SalesInUSA = Value
        End Set
    End Property
    Private m_SalesInUSA As System.Nullable(Of Integer)
    Public Property SalesInChina() As System.Nullable(Of Integer)
        Get
            Return m_SalesInChina
        End Get
        Set
            m_SalesInChina = Value
        End Set
    End Property
    Private m_SalesInChina As System.Nullable(Of Integer)
    Public Property SalesInJapan() As System.Nullable(Of Integer)
        Get
            Return m_SalesInJapan
        End Get
        Set
            m_SalesInJapan = Value
        End Set
    End Property
    Private m_SalesInJapan As System.Nullable(Of Integer)
End Class
Add a FlexChart control
Complete the following steps to initialize a FlexChart control.
Add a new Controller
In the Solution Explorer, right click the folder Controllers.
From the context menu, select Add | Controller. The Add Scaffold dialog appears.
Complete the following steps in the Add Scaffold dialog:
Select MVC 5 Controller - Empty template.
Set name of the controller (for example:
QuickStartController).Click Add.
Include the MVC references as shown below.
using C1.Web.Mvc;
using C1.Web.Mvc.Serializition;
using C1.Web.Mvc.Chart;
using <ApplicationName>.Models;
Replace the method
Index()with the following method. csharppublic ActionResult QuickStart() { // Set DataSource FlexChartDataSource ds = new FlexChartDataSource(); return View(ds.Sales); }VB
Public Function QuickStart() As ActionResult
        ' Set DataSource
        Dim ds As New FlexChartDataSource()
        Return View(ds.Sales)
End Function
Add a View for the Controller
From the Solution Explorer, expand the folder Controllers and double click the controller
QuickStartControllerto open it.Place the cursor inside the method
QuickStart().Right click and select Add View. The Add View dialog appears.
In the Add View dialog, verify that the view name is QuickStart and View engine is Razor (CSHTML).
Click Add. A view is added for the controller.
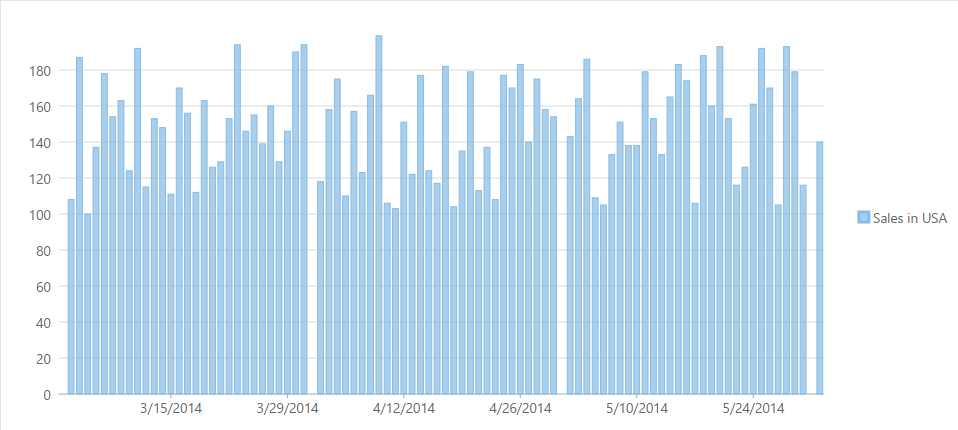
Instantiate a FlexChart control in the view QuickStart as shown below.
@using <ApplicationName>.Models;
@model IEnumerable<FruitSale>
@(Html.C1().FlexChart()
.Bind("Date", Model)
.ChartType(C1.Web.Mvc.Chart.ChartType.Column)
.Series(sers =>
  {
      sers.Add()
     .Binding("SalesInUSA")
     .Name("Sales in USA");
  })
)
Index.vbhtml
@using <ApplicationName>.Models
@ModelType IEnumerable(Of FruitSale)

@(Html.C1().FlexChart() _
    .Bind("Date", Model) _
    .ChartType(C1.Web.Mvc.Chart.ChartType.Column) _
    .Series(Sub(ser)
            ser.Add() _
            .Binding("SalesInUSA") _
            .Name("Sales in USA")
        End Sub) _)
Build and Run the Project
Click Build | Build Solution to build the project.
Press F5 to run the project.
Append the folder name and view name to the generated URL (for example: http://localhost:1234/FlexChart/Index) in the address bar of the browser to see the view.