
- ASP.NET MVC
- Getting Started
- Configuring your MVC Application
- Adding NuGet Packages to your App
- Adding Controls
- Client-Side Support
- Globalization
-
Working with Controls
- Accordion
- Barcode
- CollectionView
- DashboardLayout
- Excel
- File Manager
- Financial Charts
- FlexChart
- FlexGrid
- Transposed Grid
- FlexMap
- FlexPie
- FlexRadar
- FlexReport
- FlexSheet
- FlexViewer
- Gauge
- Input Controls
- MultiRow
- TransposedMultiRow
- OLAP
- Sunburst Chart
- TabPanel
- TreeMap
- TreeView
- Styling
- ASP.NET MVC Samples
- Release History
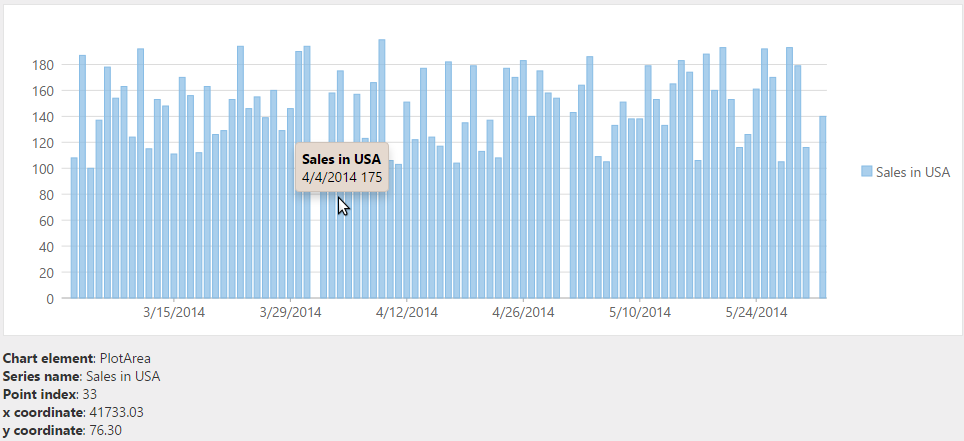
Hit Test
The HitTest() method is used to determine X and Y coordinates, as well as the index of a point on the FlexChart where the mouse hovers.
The following image shows how labels below the chart display the X, Y coordinate values and the index of the hit point on FlexChart.
The following code examples demonstrate how to display the X, Y coordinate values and index of the hit point using simple labels.
Instantiate a FlexChart as shown below.
<div id="flexChart1" style="height: 300px"></div>
@(Html.C1().FlexChart("#flexChart1")
.Bind("Date", Model)
.ChartType(C1.Web.Mvc.Chart.ChartType.Column)
.Series(sers => sers
     .Add()
     .Binding("SalesInUSA")
     .Name("Sales in USA")
  )
)
Add a
<div>tag just below the FlexChart to display the information of the hit point as shown below.<div id="info"></div>Add the following script that retrieves the X, Y coordinate values and index of the hit point and displays them in the division added just below the chart.
<script type="text/javascript">
    c1.mvc.Utils.documentReady(function ()
    {
        var chart = wijmo.Control.getControl("#flexChart1"),
            formatHitInfo = function (hitInfo, pt)
            {
                var s = '<div><b>Chart element</b>: ' + wijmo.chart.ChartElement[hitInfo.chartElement] + '</div>';
                if (hitInfo.series)
                {
                    s += '<div><b>Series name</b>: ' + hitInfo.series.name;
                    if (hitInfo.pointIndex !== null) {
                        s += '<div><b>Point index</b>: ' + hitInfo.pointIndex + '</div>';
                        if (hitInfo.chartElement == wijmo.chart.ChartElement.PlotArea)
                        {
                            s += '<div><b>x coordinate</b>: ' + pt.x.toFixed(2) + '</div>';
                            s += '<div><b>y coordinate</b>: ' + pt.y.toFixed(2) + '</div>';
                        }
                    }
                }
                return s;
            };
        chart.hostElement.onmousemove = function (e)
        {
            var hit = chart.hitTest(e);
            var info = document.getElementById("info");
            info.innerHTML = formatHitInfo(hit, chart.pointToData(e));
        };
    });
</script>