
- ASP.NET MVC
- Getting Started
- Configuring your MVC Application
- Adding NuGet Packages to your App
- Adding Controls
- Client-Side Support
- Globalization
-
Working with Controls
- Accordion
- Barcode
- CollectionView
- DashboardLayout
- Excel
- File Manager
- Financial Charts
- FlexChart
- FlexGrid
- Transposed Grid
- FlexMap
- FlexPie
- FlexRadar
- FlexReport
- FlexSheet
- FlexViewer
- Gauge
- Input Controls
- MultiRow
- TransposedMultiRow
- OLAP
- Sunburst Chart
- TabPanel
- TreeMap
- TreeView
- Styling
- ASP.NET MVC Samples
- Release History
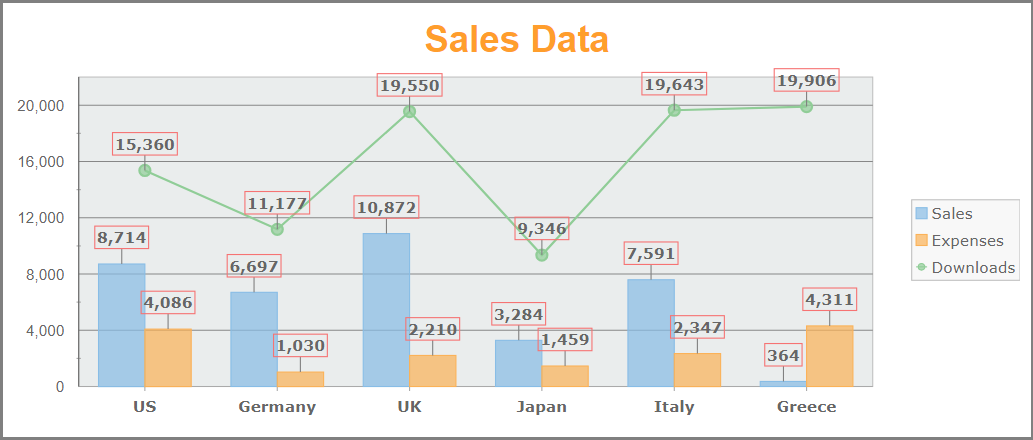
Styling FlexChart
The appearance of the FlexChart control is defined using CSS classes which represents different elements, such as plot area, legends, axis, header, series group etc. You can customize these classes to change the appearance of the FlexChart control. The custom CSS rules can be applied to the FlexChart control, by applying a CSS to the FlexChart control using the CssClass property.
In this example, we customize the default CSS rules to make the following customizations to the FlexChart control.
- Apply a solid border to the FlexChart control.
- Change the background color for the plot area of the chart.
- Change the font-size, font-weight and fill color to the header element.
- Create a rectangle shape around the legends entries and change the background color.
- Modify the font-weight and font-family for each data label entry.
- Add a colored border for each data label entry in the chart.
- Change the font-family and font-weight for the entries on the x-axis.
The following image shows how FlexChart appears after applying styles using custom CSS.
Add Custom Stylesheet
Create a new MVC application using the ComponentOne or VisualStudio templates. For more information about creating an MVC application, see Configuring your MVC Application topic.
To add a custom style sheet in your application, follow these steps:
In the Solution Explorer, right-click the Content folder.
From the context menu, select Add | Style Sheet. The Specify Name for Item dialog appears.
Set name of the style sheet (for example:
app.css)and click OK.Replace the default code of app.css file with the code given below.
.custom.wj-flexchart {
           border: grey 3px solid !important;
           border-radius: 0;
           margin-top: 15px;
       }
       .custom .wj-legend > rect {
           fill: #f8f8f8;
           stroke: #c0c0c0;
       }
       .custom .wj-legend {
           font-family:Verdana, Geneva, Tahoma, sans-serif;
       }
       .custom .wj-data-label {
           font-weight: bold;
           font-family: Verdana, Geneva, Tahoma, sans-serif;
       }
       .custom .wj-data-label-border {
           stroke: rgb(246, 115, 115);
       }
       .custom .wj-header .wj-title {
           font-size: 25pt;
           fill: #FF9E2C;
           font-weight: bold;
       }
       .custom .wj-axis-x .wj-label {
           font-weight: bold;
           font-family: Verdana, Geneva, Tahoma, sans-serif;
           transform: rotate(45,100,);
       }
       .wj-plot-area > rect {
           fill: #EAEDED;
           stroke: #c0c0c0;
       }
Styling.cshtml
@using <ApplicationName>.Models
@model IEnumerable<FlexChartData.Sale>
@section Scripts
{
    <link href=""~/Content/app.css"" rel=""stylesheet"" />
}
@(Html.C1().FlexChart<FlexChartData.Sale>().Id("theChart")
            .Bind("Country", Model)
            .Header("Sales Data")
            .AxisY(ay => ay
            .AxisLine(true).Max(22000)
            .MinorTickMarks(C1.Web.Mvc.Chart.AxisTickMark.Cross))
            .DataLabel(dl => dl.Position(C1.Web.Mvc.Chart.LabelPosition.Top).ConnectingLine(true).Content("{y}").Border(true))
            .CssClass("custom")
            .Series(sb =>
            {
                sb.Add().Binding("Sales").Name("Sales");
                sb.Add().Binding("Expenses").Name("Expenses");
                sb.Add().Binding("Downloads").Name("Downloads").ChartType(C1.Web.Mvc.Chart.ChartType.LineSymbols);
            }))