
- Spread for WPF Overview
- About the Product
- Getting Started
- Quick Start
- Designer
- Features
- Assembly Reference
Column Chart
Column charts are vertical representations of bar charts. It uses the x-axis as a category axis. These types of charts are preferred where the number of values is too large to be used on an x-axis, while bar charts are more suitable for cases where long category titles are difficult to fit on an x-axis. For example, the population share of different countries across the world can be represented using a column chart.
Types of Column Charts
Spread for WPF supports the following types of column charts.
Sample Image | Description |
|---|---|
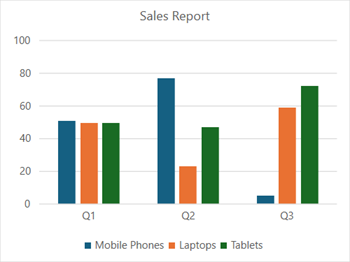
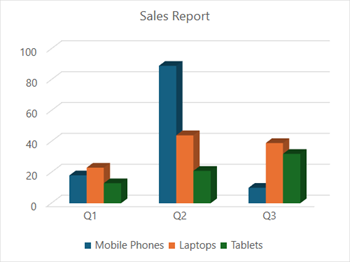
| ChartType.ColumnClustered Represents a clustered column chart. It is used to compare different values across different categories and show them in two-dimensional or three-dimensional vertical rectangles. This chart can be stacked normally in a regular way just like any other chart. |
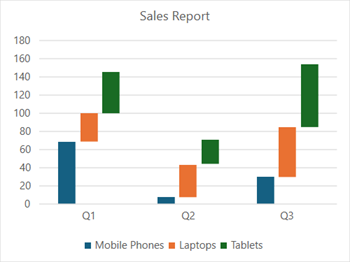
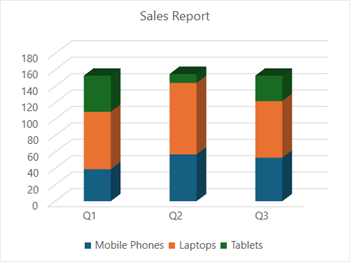
| ChartType.ColumnStacked Represents a stacked column chart. It is used to display the relationship of specific items to the whole across different categories and plot values in two-dimensional or three-dimensional vertical rectangles. This chart stacks the data series vertically (in a vertical direction). |
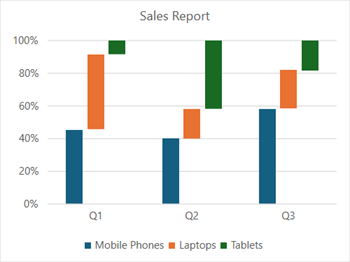
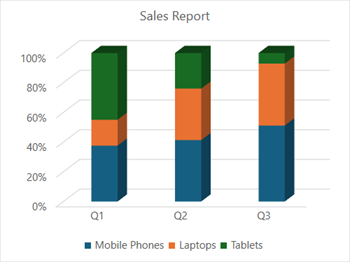
| ChartType.ColumnStacked100 Represents a 100% stacked column chart. It is used to perform comparisons of percentages that each of the values are contributing to the total, across all your categories in the spreadsheet. This chart stacks the data series vertically and equalizes the plotted values to meet 100%. The plotted values are displayed in two-dimensional and three-dimensional rectangles. |
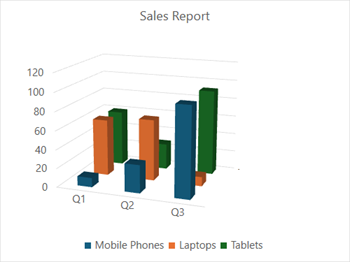
| ChartType.Column3D Represents a 3D column chart. It is used to display the chart demonstration in 3D, which is a modification of the 2DColumn chart. It does not have a third dimension; it only looks volumetric in appearance. |
| ChartType.Column3DClustered Represents a clustered 3D column chart. It is used to represent the ColumnClustered chart demonstration in 3D, which looks volumetric in appearance. |
| ChartType.Column3DStacked Represents a stacked 3D column chart. It is used to represent the ColumnStacked chart demonstration in 3D, which looks volumetric in appearance. |
| ChartType.Column3DStacked100 Represents a 100% stacked 3D column chart. It is used to represent the ColumnStacked100 chart demonstration in 3D, which is a modification of a 2D chart in appearance. |
Using Code
Refer to the following example code to add a column chart.
C#
// Add data.
spreadSheet1.Workbook.ActiveSheet.Cells[0, 1].Value = "Q1";
spreadSheet1.Workbook.ActiveSheet.Cells[0, 2].Value = "Q2";
spreadSheet1.Workbook.ActiveSheet.Cells[0, 3].Value = "Q3";
spreadSheet1.Workbook.ActiveSheet.Cells[1, 0].Value = "Mobile Phones";
spreadSheet1.Workbook.ActiveSheet.Cells[2, 0].Value = "Laptops";
spreadSheet1.Workbook.ActiveSheet.Cells[3, 0].Value = "Tablets";
for (var r = 1; r <= 3; r++)
{
    for (var c = 1; c <= 3; c++)
    {
        Random random = new Random();
        spreadSheet1.Workbook.ActiveSheet.Cells[r, c].Value = random.Next(0, 100);
    }
}
spreadSheet1.Workbook.ActiveSheet.Cells["A1:D4"].Select();
// Add Column3D chart.
spreadSheet1.Workbook.ActiveSheet.Shapes.AddChart(GrapeCity.Spreadsheet.Charts.ChartType.Column3D, 100, 150, 400, 300, true);
VB
' Add data.
spreadSheet1.Workbook.ActiveSheet.Cells(0, 1).Value = "Q1"
spreadSheet1.Workbook.ActiveSheet.Cells(0, 2).Value = "Q2"
spreadSheet1.Workbook.ActiveSheet.Cells(0, 3).Value = "Q3"
spreadSheet1.Workbook.ActiveSheet.Cells(1, 0).Value = "Mobile Phones"
spreadSheet1.Workbook.ActiveSheet.Cells(2, 0).Value = "Laptops"
spreadSheet1.Workbook.ActiveSheet.Cells(3, 0).Value = "Tablets"
For r = 1 To 3
    For c = 1 To 3
        Dim random As Random = New Random()
        spreadSheet1.Workbook.ActiveSheet.Cells(r, c).Value = random.Next(0, 100)
    Next
Next
spreadSheet1.Workbook.ActiveSheet.Cells("A1:D4").Select()
' Add Column3D chart.
spreadSheet1.Workbook.ActiveSheet.Shapes.AddChart(GrapeCity.Spreadsheet.Charts.ChartType.Column3D, 100, 150, 400, 300, True)